Response of biogenic zinc oxide nanoparticles against periimplantitis triggering non periodontal pathogen
Abstract
Biogenic zinc oxide nanoparticles (BZnONPs) as a nano medicine attain high importance in the treatment of Peri Implantitis (PI). Present study was aimed to biosynthesize, optimize, characterize and evaluate the response of BZnONPs against PI triggering non periodontal pathogen. The BZnONPs synthesis, characterization, optimization and stability were based on UV-Visible, FTIR, XRD, FESEM, and EDX data. The BZnONPs were tested against S. aureus. Treatment of zinc acetate with Dimocarpus longan leaves extract resulted in formation of BZnONPs, which exhibited the absorbance signal between 350-359 nm. Optimization study established 0.05 M zinc acetate, 6 ml of DLL aqueous extract, pH 12, and 2 h stirring time as parametric requirements for BZnONPs synthesis. Stability study of BZnONPs exhibited absorbance at 340 nm. The BZnONPs were characterized based on broad and shifted FT-IR bands, XRD signals (at 2θ values of 31.70°, 34.33°, 36.19°, 47.45°, 56.52°, 62.78°, 67.88° and 72.45°), size range from 42.07-61.33 nm in FESEM, and elemental zinc 74.22 % in EDX spectrum. The BZnONPs exhibited high inhibitory response towards S. aureus. Present study establish that BZnONPs synthesis using Dimocarpus longan leaves aqueous extract is a facile method and reports that BZnONPs could be potential remedy for PI.
Keywords
BZnONPs, Infections, Stability, Optimization, Characterization
Introduction
Human ecosystem is reported to possess almost equal ratio of bacteria and cells. Trivial disturbance in this ratio may lead to uncountable infections (Fuloria, Fuloria, Chia, Karupiah, & Sathasivam, 2019). During dental implant treatment such disturbance may lead to peri implantitis (PI). The PI treatment is major challenge for the dentists. The PI site is reported to possess high quantum of S. aureus (Ata-Ali et al., 2011). The high use of conventional antimicrobials in PI offers the demerits such as multiple drug resistance, immune suppression, allergic reactions, and high mortality risk (Javed et al., 2013). Nanoparticles (NPs) gain high importance in modern therapy due to the development of bacterial resistance towards antimicrobial agents. The nano particles have started to surpass the conventional antibiotics, attributed to their nontoxic and bio-safety properties (Webster & Seil, 2012). Studies suggest that nano particles possess selective toxicity against bacteria and minimum effects over human cells (Tiwari et al., 2018). Previous decade logged massive research over metallic NPs. Among metallic nano composites the massive applications of zinc oxide nanoparticles (ZnONPs) to augment the activity of antimicrobials and other biomedicines, always withdraw researcher’s attention (Jacob & Raju, 2019). The BZnONPs act as a powerful weapon against S. aureus, the PI triggering non periodontal pathogen (Sirelkhatim et al., 2015; Valente & Andreana, 2016). Zinc not only acts a chief trace element for human body but also serve as a co-factor for over 300 mammal enzymes. It has an important function in sustaining vital cellular process like DNA repair/replication, oxidation stress, cell cycle progression, and apoptosis (Kooti et al., 2017). The ZnOs proposed action mechanism involve releasing of ROS, which promotes membrane peroxidation intern reduction in cell activity owing to DNA and proteins leakage (Tiwari et al., 2018). The ZnONPs can be synthesized chemically and physically such as sol-gel, precipitation, zinc alcohol reaction, vapour transport, high energy ball milling, pulse vapour and hydrothermal methods etc. These methods render high cost burden, toxicity and other potential hazards (Dhand et al., 2015). The production green of biogenic ZnONPs (BZnONPs) offer several advantages such as: simplicity, eco-friendly, non-toxic, cost-effectiveness, reproducibility and stability (Azizi, Ahmad, Namvar, & Mohamad, 2014). The longan leaves are believed to have high therapeutic activities (Liu, 2012). Based on the benefit of high antimicrobial potential, biocompatibility, ease of synthesis, and high selectivity of BZnoNPs, in present study, the ZnONPs were selected to be synthesized using DLL extract.
Materials and Methods
Reagents and chemicals
The BZnONPs were synthesized using Dimocarpus longan leaves extract. The chemical and biological materials were procured from Bendosen, HmbG Chemicals, Merck KGaA, Nacalai Tesque, R&M Chemicals, Fisher chemicals, and HiMedia. The glass wares were cleaned and washed with deionized water and dried at 160°C for 2 h. The plastic ware was autoclaved before initiation of antimicrobial experiment.
Plant extract preparation
Plant extract was developed by following standard protocol with small variation (Cecilia et al., 2016). Briefly, the Dimocarpus longan leaves were collected (from longan tree located in Bedong, Kedah, Malaysia), washed with water, dried, powdered (25 g), boiled (in 100 ml of water), filtered (using filter paper Whatman no. 1), and filtrate was stored at 4 to 8°C in refrigerator for further synthesis of BZnONPs.
Synthesis of BZnONPs
The BZnONPs were synthesized according to standard protocol with slight modifications (Bala et al., 2015). Briefly, mixture of 6 ml plant extract and zinc acetate (0.05 M) was stirred for 15 minutes. Obtained mixture was treated with 2 M sodium hydroxide until the pH 12 was achieved. The stirring was done for 2 h to cause precipitation and precipitates after filtration and washing were dried at 60ºC. Briefly, for 10 minutes the mixture of zinc acetate solution (0.05 M) and 6 ml plant extract was stirred.
UV–Visible analysis
The UV visible analysis was conducted as per the reported protocol with trivial modifications (Ahmed, Sarhan, & Hassan, 2016). Briefly, solution of 5 mg of dried BZnONPs in 10 ml of deionized water was subjected to UV–Visible analysis (using Shimadzu U-2800 spectrophotometer at scanning speed of 300 nm/min) at room temperature to detect the surface plasmon resonance (SPR) peak at 200 to 800 nm.
Optimization of parameters for BZnONPs synthesis
The synthesis of BZnONPs was optimized based on UV-Visible spectrometric studies maintained under different parametric settings, namely: concentration of Zinc acetate, volume of plant extract, time and pH. Optimization was conducted as per reported protocols with trivial modifications (Chinnasamy, Tamilselvam, Karthick, Sidharth, & Senthilnathan, 2018).
Optimization of zinc acetate concentration for BZnONPs synthesis
To optimize the zinc acetate concentration for synthesis of BZnONPs, the experimental method involved preparation of four individual reaction mixtures, maintained in same conditions except for concentrations of zinc acetate (0.02 M, 0.03 M, 0.04 M and 0.05 M). The four mixtures were subjected to visual examination (for monitoring of colour darkening) and UV-Visible spectrometry (for observation of SPR signal in UV-Visible spectrum) to determine the ideal concentration of zinc acetate required for synthesis of BZnONPs. Similarly, other parametric optimization also involved visible examination and UV-visible analysis.
Optimization of volume of plant extract
Optimization of concentration of plant extract involved preparation of four individual reaction mixtures maintained in same parametric conditions, except for volume of plant extract (2 ml, 4 ml, 6 ml and 8 ml) taken in four different concentrations.
Optimization of pH
Optimization of pH for synthesis of BZnONPs involved preparation of four solution mixtures maintained in same conditions, except for pH maintained at pH 4, pH 7, pH 12 and pH 14. The pH of reaction mixtures was adjusted by adding 0.1 N HCl, 2 M NaOH and 3 M NaOH.
Optimization of time
The mixture was maintained in similar reaction conditions except for time. The mixture was noticed for completion of reaction at different time intervals that is 0 h, ½ h, 1 h, 2 h and 24 h.
Stability of BZnONPs
After optimization of synthetic parameters for synthesis of BZnONPs, the pure BZnONPs were subjected to stability studies. The BZnONPs stability was determined on the basis of SPR signal range (340 to 390 nm) in UV-Visible absorption spectrum. The measurements for stability study were made after 24 h, 7 days, 15 days, and 30 days. The procedure for stability study was performed based on reported methods with minor modifications (Agarwal, Kumar, & Rajeshkumar, 2017).
Characterization of BZnONPs
After optimization and stability studies, the BZnONPs were subjected to characterization studies. Prior to characterization, the BZnONPs were repeatedly washed and centrifuged using deionized water (Chinnasamy et al., 2018; Fuloria et al., 2019). The characterization of BZnONPs was based on FTIR spectrometry, FESEM, XRD, and EDX spectrometry.
Antimicrobial activity of BZnONPs against non-periodontal pathogen
The BZnONPs antimicrobial potential was determined as per standard protocol for well diffusion method with trivial modifications (Mekonnen, Yitayew, Tesema, & Taddese, 2016). Briefly, the BZnONPs were tested against S. aureus (ATCC 29737). The pure bacterial strain culture was sub cultured over nutrient broth at 37°C. The subculture bacterial strain was spread uniformly over nutrient agar. The 6 mm diameter wells were bored over nutrient agar. In each well of nutrient agar plate, plant extract (20, 40, 60, 80 and 100 mg/mL), BZnONPs (20, 40, 60, 80 and 100 mg/mL), and ciprofloxacin (50 µg/mL) each in a volume of about 50 µl were added. The plates were refrigerated for 1 h, incubated at 37°C for 24 h and finally zone of inhibition was recorded.
Results and Discussion
Green synthesis of BZnO
Addition of 2 M NaOH into the mixture of zinc acetate and plant extract at room temperature lead to dark colour solution with white precipitates, which indicated BZnONPs synthesis. In the presence of water and NaOH, zinc acetate dihydrate was reduced to Zn (OH) 2 which precipitated to form BZnONPs. Formation of BZnONPs was further confirmed by UV-Visible analysis (Bala et al., 2015; Chinnasamy et al., 2018).
|
Microorganism |
Zone of Inhibition in mm |
||||||||||
|---|---|---|---|---|---|---|---|---|---|---|---|
|
Plant extract |
BZnONPs |
Ciprofloxacin (μg/ml) |
|||||||||
|
Concentration (mg/ml) |
20 |
40 |
60 |
80 |
100 |
20 |
40 |
60 |
80 |
100 |
50 |
|
S. aureus |
N/A |
N/A |
N/A |
N/A |
N/A |
N/A |
16 |
16 |
17 |
17 |
21 |
Optimization of parameters for BZnONPs synthesis
The UV-visible analysis assisted study, optimized five key parameters for the synthesis of BZnONPs, namely: zinc acetate concentration, volume of plant extract, pH, and time. In present investigation, the optimization results were validated based on presence of SPR peak within the results range claimed by other standard investigations (Ahmed et al., 2016).
Optimization of zinc acetate concentration
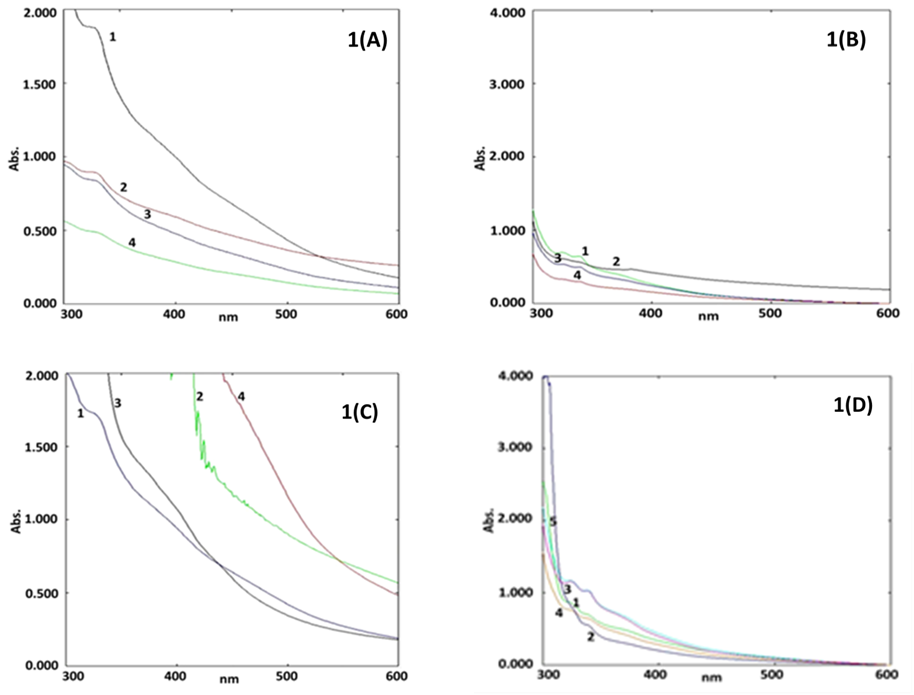
The UV-Visible analysis assisted optimization of BZnONPs synthesis based on four parametric concentrations of zinc acetate offered a UV-Visible spectrum containing given in Figure 1(A). The spectrum displayed four curves 1, 2, 3, and 4 corresponding to zinc acetate concentration of 0.02 M, 0.03 M, 0.04 M and 0.05 M, exhibited signal at 345 nm, 332 nm, 330 nm and 352 nm respectively for BZnONPs. The SPR signal at 352 nm was displayed in curve 4, which revealed completion of BZnONPs green synthesis. Hence, 0.05 M zinc acetate was considered as optimum for synthesis of BZnONPs.
Optimization of plant extract volume
Optimization study over synthesis of BZnONPs based on four concentrations of plant extract as parametric requirement generated UV-visible absorption spectrum given in Figure 1(B). The spectrum contained four curves 1, 2, 3, and 4 corresponding to 2 ml, 4 ml, 6 ml, and 8 ml respectively. All four curves showed SPR signal in range of 342 nm to 350 nm. Curve 3 (6 ml) showed highest absorbance at 350 nm. Thus 6 ml plant extract was fixed as optimum parametric requirement for the ZnONPs synthesis.
Optimization of pH
The UV-Visible experiment aided optimization study over green synthesis of ZnONPs based on four different pH yielded a UV-Visible spectrum given in Figure 1(C). The spectrum contained four curves 1, 2, 3 and 4 corresponding to pH 12, pH 13, pH 4 and pH 7 respectively. The UV-Visible spectrum, displayed no absorption peak for BZnONPs in all curves except in curve 1 (pH 12) which displayed an SPR signal at 350 nm indicating the completion of BZnONPs synthesis. Hence, maintaining the reaction at pH 12 was considered as optimum for BZnONPs synthesis.
Optimization of time
The UV-Visible study over BZnONPs synthesis based on optimization of time produced a UV-visible spectrum given in Figure 1(D). The spectrum contained five curves 1, 2, 3, 4 and 5 corresponding to 0 h, ½ h, 1 h, 2 h, and 24 h respectively. Curve 1 (0 h) displayed absorption signal at 320 nm; curve 2 (½ h) showed peak at 344 nm; curve 3 (1 h) and 4 (24 h) showed λ max at 357 nm.; curve 4 (2 h) displayed absorption signal for ZnONPs at 359 nm. Since, curve 4 showed highest absorption signal for the BZnONPs, 2 h was considered as optimum stirring time for BZnONPs synthesis.
Stability study for biogenic ZnONPs
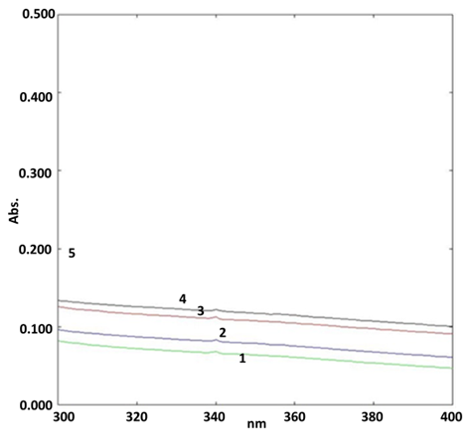
The UV-Visible spectrometry assisted in the stability study of synthesized BZnONPs. The stability study was conducted for 24 h, 7 days, 15 days and 30 days. The Figure 2 represented, the UV-Visible absorption spectrum of BZnONPs containing 1, 2, 3 and 4 curves for 24 h, 7 day, 15 days and 30 days respectively. The Figure 2, illustrated maintenance of ZnONPs signal at 340 nm and indicated stability of BZnONPs.
Characterization of BZnONPs
The formation of BZnONPs was determined based on a change in color of the solution, UV–Visible spectrometer (Shimadzu U-2800) and FTIR (PerkinElmer SLE/MSC4/29) spectral data. The FESEM (FEI Nova NanoSEM 450) measurement realized the morphology of ZnONPs. The ZnONPs crystal nature was determined by observing their XRD pattern using PANalytical X’Pert PRO MRD PW 3040/60 X-Ray diffractometer. The XRD spectrum was recorded by CuKαβ radiation at a wavelength of 1.54060 Å with 2θ in the range from 10° – 80°. The EDX spectrum was generated by FEI Nova Nano SEM 450 with EDX unit.
Fourier Transformed Infrared (FTIR) analysis
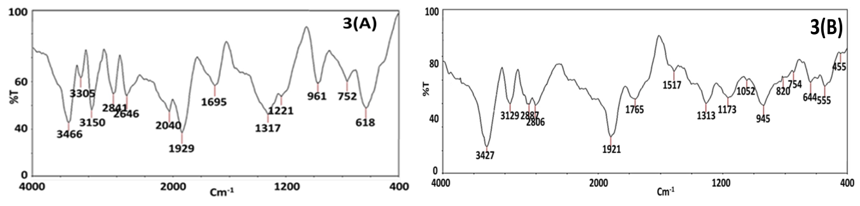
The FTIR study aided in determination of reduction and oxidation induced by phytochemicals present in the plant extract to form BZnONPs (Jamdagni, Khatri, & Rana, 2018). The FT-IR data of plant extract given in Figure 3(A), displayed characteristic IR bands at 3466 cm-1 (O-H), 2841 cm-1 (C-H), 1695 cm-1 (C=O). The FTIR spectrum for ZnONPs given in Figure 3(B), displayed shifted bands 3427 cm-1 (O-H vibrations), 2887 cm-1 (C-H vibrations), 1765 cm-1 (C=O vibrations). The resultant data indicated the formation of BZnONPs and the oxidation and reduction of zinc acetate to zinc oxide by phytochemical moieties present in the plant extract (Fuloria et al., 2019). The presence of peak at 455 cm-1 due to stretching of Zn-O bond confirmed the formation of BZnONPs (Babu, Reddy, Sujatha, Reddy, & Mallika, 2013). The plant extract was recognized as a dual capping (stabilizing) and oxidation & reduction agent based on the comparison of FTIR spectrum of plant extract and BZnONPs. The Figure 3(A) FTIR spectrum of plant extract was similar to Figure 3(B) FTIR spectrum of BZnONPs, as it preserved the majority of signals with marginal shifting and broadening. For example, 3466 cm-1 (O-H vibrations) narrow band present in Figure 3(A) FTIR spectrum of plant extract was shifted to 3427 cm-1 as a broad band in Figure 3(B) FTIR vibrations spectrum of BZnONPs.
Field Emission Scanning Electron Microscopy (FESEM)
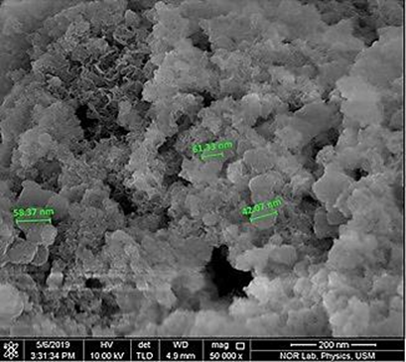
FESEM analysis was used to study the morphology of the BZNONPs. The FESEM micrograph of BZnONPs is shown in Figure 4. FESEM image showed that BZnONPs formed are polydispersed and spherical in shape. The particle sizes for BZnONPs formed ranging from 42.07-61.33 nm complied with nano-size described by other researchers (Santhoshkumar, Kumar, & Rajeshkumar, 2017).
X-Ray diffraction (XRD)
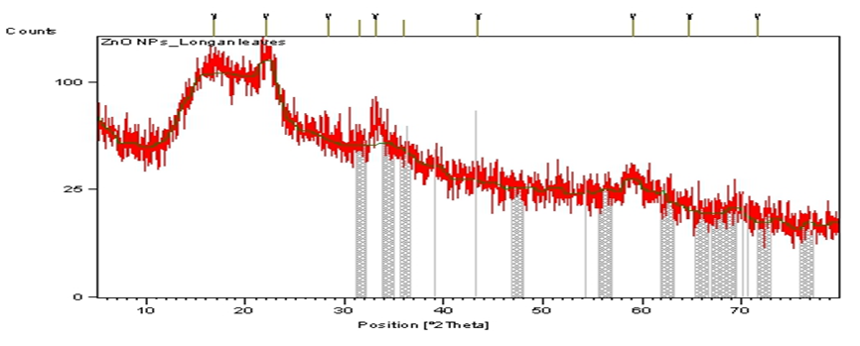
The BZnONPs were characterized using powder XRD analysis to confirm the NPs as zinc oxide and to understand the structural information. Crystal nature of BZnONPs was confirmed based on analysis of XRD pattern. The analysis of XRD pattern (Figure 5) showed peak positions with 2θ values of 31.70°, 34.33°, 36.19°, 47.45°, 56.52°, 62.78°, 67.88° and 72.45° indexed to the (100), (002), (101), (102), (110), (103), (112) and (202) reflection planes respectively. By using the Debye–Scherrer formula, the average crystallite size of was found to be in the range of 37.55 to 67.09 nm. The XRD pattern results of present study were also verified by other research studies (Panda et al., 2017).
Energy dispersive X-Ray diffraction (EDX) analysis
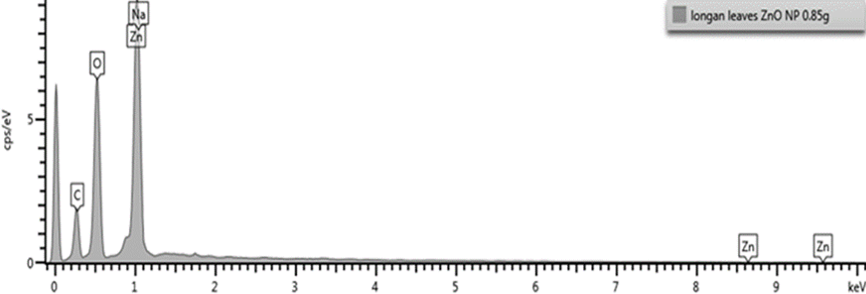
The EDX analysis was used to understand the presence of element involved in the development of nanoparticles. The EDX spectrum of BZnONPs (Figure 6) revealed strong signal in the zinc region and confirms the formation of BZnONPs. Zinc (wt. 74.22%) was the major constituent element followed by oxygen.
Antimicrobial activity
Optimized and characterized BZnONPs were tested for their inhibition potential against S. aureus the PI triggering non periodontal pathogen (data given in Table 1). The plant extract showed no zone of inhibition against S. aureus, whereas BZNONPs showed 17 mm zone of inhibition against S. aureus at 80 mg/mL and 100 mg/mL administered dose. A pattern was observed in the antimicrobial activity of newer BZnONPs. There was a significant increase in the zone of inhibition of BZnONPs. As the concentration of BZnONPs was increased from 20 mg/ml to 100 mg/ml, the antimicrobial activity results indicated that capping of ZnO with biochemical moieties of plant extract caused a marked increase in the antimicrobial potential of BZnONPs. This pattern of increment in antimicrobial response of BZnONPs is supported by other investigations also (Agarwal et al., 2017; Jones, Ray, Ranjit, & Manna, 2008). Based on antimicrobial results of present study it can be postulated that BZnONPs possess high antimicrobial potential against S. aureus.
Conclusion
The present study was focused on synthesis of BZnONPs which do not involve the use of harmful chemicals and is eco-friendly. Optimization study established to use 0.05 M zinc aetate, 6 ml of plant extract, pH 12 and 2 h of time as the parametric requirement for synthesis of BZnONPs using Dimocarpus longan leaves extract. The visual examination, UV-visible analysis and other characterization methods supported for successful biosynthesis and stability of ZnONPS. Based on antimicrobial results of present study it can be postulated that BZnONPs possess high antimicrobial potential against S. aureus. Hence, present study concludes that Dimocarpus longan leaves aqueous extract is a potential source for the biosynthesis of potent antimicrobial BZnONPs.