Isolation, Identification and Characterization of Ximenynic Acid with Anti-Aging Activity from Santalum Album
Abstract
Medicinal plants and its products have been used as a remedial agent in most irising countries for treating diseases. Furthermore, an increasing reliance on the use of medicinal plants in industrialized societies has been traced for the extraction and development of several drugs and chemotherapeutics from these herbal plants. Novel acetylenic fatty acids named Ximenynic acid (XMA) were successfully isolated from the seeds of Santalum album L by N-Hexane extraction. Ximenynic acid (or Santalbic acid) is one of the few acetylenic fatty acids occurring at higher levels in plant seed oils. Ximenynic acid predominantly exists in the seed oil of Santalaceae, Olacaceae, and Opiliaceae families. The structure of XMA was characterized by UV-visible spectroscopy, Infrared Spectrum (IR), NMR Spectroscopy, Differential scanning calorimetry (DSC), Thermal Gravimetric Analysis (TGA), X-ray diffraction (XRD), Fourier Transform Infrared Spectroscopy (FT-IR), LCMS spectral analysis. The antiaging activities were assessed by anti-collagenase enzyme assay. Structural analysis revealed that XMA was a crystalline material with a melting point of 38.25°C and an average molecular weight of 278 kDa. Which is composed of carboxylic acid, butylenic acid, methylene, allylic in their structure. The antiaging assay showed that XMA exhibited significant collagenase inhibition activity as compared with Catechin. These findings suggested that the acetylenic fatty acids XMA could be served as a novel antiaging in Pharmaceutical as well as the cosmetic industry.
Keywords
Ximenynic acid, Santalum album, isolation, Characterization, Antiaging assay
Introduction
Plants are considered an essential source of medicines for humans. Plant parts like leaves, flowers, roots, stems, seeds, and fruit are used as food resources for human as well as a safe medicine for the treatment of different diseases. Plant-derived herbal medicine is used as the main source for the treatment of diseases since ancient times (Hussain et al., 2013). Ethnopharmacology of natural products isolated from herbal plants possesses pharmacological and therapeutic efficacy for treating diseases (Pan et al., 2013). Aging is a natural process in all living organisms. Anti-aging has always been an interest in mankind. After much research being done in the field, it is now widely accepted that aging is a multifarious event resulting from the collective effects of genetic variation, environmental risk factors, nutritional factors and lifestyle (Chang, Kwok, & Yuen, 2010; Harman, 1998).
In recent years, the study of herbal medicine has received increasing attention in aging research. It is suggested that some traditional herbs have anti-aging properties and they are potential candidates for the treatment of chronic and aging-associated diseases. (Christensen, 2001; Harman, 1998).
Santalum album L., namely Sandalwood, given great respect as "Green Gold," is a traditional hemiparasitic tree and has an extensive record in Indian religious rituals and traditional Chinese medicine (Agnihotri & Tamrakar, 2017; Kim et al., 2006). Their essential oil (sandalwood oil) is broadly used in the cosmetic, perfumery, and aromatherapy industries. It has been reported to have diverse biological properties such as antiviral, anticarcinogenesis, and antitumor effects (Howes, Simmonds, & Kite, 2004). The herb is stated to have α-santalol, β-santalol, α-santalene, β-santalene, α-santalal, β-santalal, α-curcumene, tricycloekasantal (Bapat & Rao, 1988; Guo, Zhang, Gao, Qu, & Liu, 2014). The seed oil of the Santalum album is shadowy red viscid fixed oil containing santalbic acid (or ximenynic acid) and stearolic acid (9-octadecenoic acid) (Aitzetmüller, Matthäus, & Friedrich, 2003; Pasha & Ahmad, 1993). Ximenynic acid, octadeca-11-trans-en- 9-ynoic acid, is one of the few acetylenic fatty acids taking place at higher levels in plant seed oils (Carballeira, 2008). In universal, ximenynic acid exhibits many biological activities and pharmacological effects, including antibacterial, antifungal, anti-inflammatory activities (Konczak, Zabaras, Dunstan, & Aguas, 2010).
Since the demand for ximenynic acid has an increasing trend, it is important to synthesized new methods of this ximenynic acid. The aim of this article is to syntheses ximenynic acid with extraction, identification and purification of ximenynic acid, as well as the recent findings regarding its pharmacological activities and the different approaches carried out to increase the use of ximenynic acid in different formulation.
Materials and Methods
Plant materials
Santalum album L. Seed was collected from a local Shop in Pune. Their identity and Authentication were confirmed by the Department of Pharmacognosy Dr. D. Y. Patil Institute of Pharmaceutical Research and sciences, Pimpri, India, by correlating their morphological and microscopical characters with those given in the literature. The remaining seed samples were dried in the shade. Coarse powder (60 #) of dried leaves of plants was stored for their microscopical study and phytochemical investigations.
Extraction, isolation and purification of XMA
Santalum album L. Seed samples were ground with a pestle and mortar and extracted N-hexane in a Soxhlet apparatus for 2 hr. The solution was dried to yield a viscous, pale yellow oil. The oil was refluxed with a solution of potassium hydroxide in 95% ethanol for 1 hr. The mixture was cooled and acidified with HCI to pH 1. The Free Fatty Acid as viscous oil was obtained by drying the solution over anhydrous sodium sulfate. Ximenynic acid was obtained by crystallization from N-hexane at 25̊ C. Recrystallization gave trans-ximenynic acid as white flakes, melting point 39̊ C.
Acetylenic fatty acids characterizations and structural analysis of XMA
FT-IR spectra analysis
The FT-IR spectrum of the XMA was determined using a Fourier transform infrared spectrophotometer (FT-IR) (Spectrum one FT-IR, Perkin Elmer Co., USA 1600 apparatus). XMA samples were ground with KBr powder and then pressed into pellets for FT-IR determination in the frequency range of 4000–400 cm−1.
XRD analysis
The XRPD analysis of isolated XMA was carried out in an XRD 6000 diffractometer (Shimadzu) with adopted scanning from 10̊ to 70̊ (2̊ min-1 ) on the 2θ scale and Cu (kα1) radiation. The equipment was operated on 40.0 kV and 30.0 mA. The data were plotted by means of the software Origin version 8.1.
DSC analysis
The DSC curves were obtained on a TA Instruments Calorimeter; model DSC Q20, using aluminum crucibles with about 2 ± 0.1 mg of samples under the nitrogen atmosphere, at the flow of 50 mL min-1. Rising temperature experiments were conducted at the temperature range from 25 to 400̊ C and heating rate of 10̊ C min-1.
TGA analysis
Thermogravimetric analyses were performed in a TG apparatus (Shimadzu, Japan). Sample (2.0 mg) was heated at a rate of 10°C/min from ambient temperature to 200°C. Nitrogen was used as the purge gas at a flow rate of 20 ml/ min.
LCMS analysis
The LC-MS analysis was carried out at Sai Lifesciences Pune, Maharashtra, India. 20 µL of compound (in methanol) was injected into the LC-MS and the mass spectra of the XMA was recorded. A mobile phase of methanol: water (40:60), at a flow rate of 0.2 mL min−1 for 60 min, was used for the separation on a BDS HYPERSIL C-18 (4.6 × 250 mm, 50 µm) 97 HPLC column. Mass spectra were obtained using ESI-Mass Spectrometer equipped with an electrospray ionization source, in positive ion mode under the flow of Helium gas at 1 mL min−1.
NMR analysis
XMA dried in a vacuum over P2O5 for 3 days, and then 20 mg of the sample was dissolved in 2.0mL of D2O. 1H NMR and 13C NMR spectrum recorded by AVANCE III 400MHz NMR spectrometer (Bruker Corporation, Switzerland). Chemical shifts were given in ppm.
In vitro antiaging activities analysis of XMA
Anti-collagenase enzyme assay
The assay employed was based on a spectrophotometric method with some modifications for use in a microplate reader. 50 μL trisine buffer solution (pH 7.5), 50 μLof samples with different concentrations and 50 μL of the enzyme (125 U/ml ChC) were added into 96-well microplate. To start the reaction 50 μL of 0.5 mM N-(3-[2-Furyl]-acryloyl)LeuGly-Pro-Ala (FALGPA) was added. The solution was then incubated for 20 minutes after the reaction started. The decrease of FALGPA absorbance was monitored at 340 nm in the microplate reader at a constant temperature of 25°C. Standard Catechin was used for comparison. Negative controls were performed with water.
Enzyme inhibition activity(%)
Results and Discussion
Acetylenic fatty acids characterizations and structural analysis of XMAFT- IR spectra analysis
The IR spectrum is shown in Figure 1. The characteristic absorptions were performed in the range of 400– 4000 cm−1 by FT-IR spectra. The broad and intense absorption peak around 3458.48 cm−1was attributed to the Bonded –OH stretching, and the weak band near 3107.43cm−1 was due to the -C=CH. That also shown Absorbance at 2908.75 cm−1 for the Alkane-CH, 2222.07cm−1 for -C≡C-, 1695.49 cm−1 for Acetic carbonyl-C=O. One stretching peaks at 1437.02cm−1 were due to the presence of -C=C-Aliphatic bond. The Absorbance at 1257.63 cm−1 was the indication of -C=O hetero atom. The band at 943.22 cm−1 could be assigned to the presence of -C=C-di-substituted olefinic. These absorption bands belonged to the characteristic functional groups of Acetylenic fatty acids.
XRD analysis
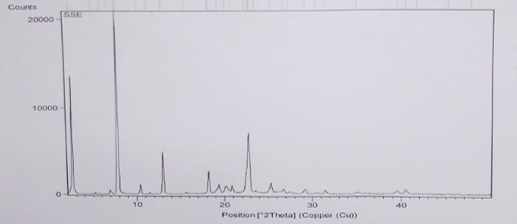
The X-ray diffractogram of XMA is shown in Figure 2. The interplanar spacing has been calculated using Bragg’s equation given as; nλ = 2d sinθ, where θ is one half the angle read from the diffractogram. As presented in Figure 2, the sample shows strong peaks at approximately 8°, 11°, 14°, and 24° 2θ. However, other peaks between 18° and 19° 2θ, are very weak and unresolved or are shoulders on more intense peaks. The result of the XPRD corroborates that of XMA is present as a crystalline material.
DSC analysis
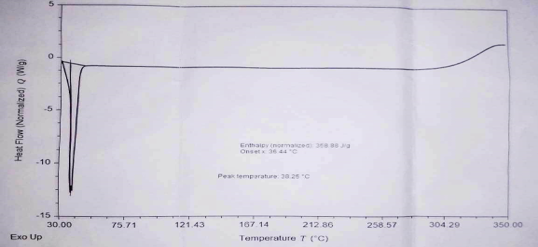
Differential scanning calorimetry (DSC) was used to measure the occurrence of exothermal or endothermal changes with an increase in temperature. DSC, because of its sensitivity and accuracy, has been extensively used to study the phase transitions of polymers. The thermogram for XMA is shown in Figure 3. It shows that the XMA has both amorphous and crystalline portions. Glass transition (Tg) temperature occurred at 38.25°C while a melting peak was observed at about 39°C. One endothermic peak is exhibited by the sample corresponding to its melting point. The continuous (broad) endothermic transition that followed the glass transition is indicative of crystallite melting occurring over the glass transition range. The glass transition temperature (Tg) was also observed to be very high, indicating a high degree of crystallinity of the XMA. The knowledge of Tg is essential in production processes and storage as Tg is affected by moisture and other additives, facilitating conversion to the rubbery state and hence facilitating crystallization through molecular rearrangement. No decomposition of the sample was visible after melting, as there was no other exothermic event after 38.25°C, thus, indicating the absence of impurities.
TGA analysis
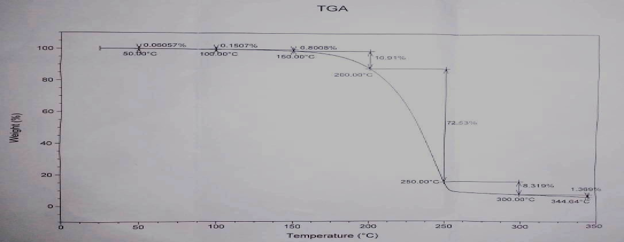
The thermogravimetric analysis (TGA) was used to determine the weight loss of the material on heating. Transitions involving mass changes are detected by TGA as a function of temperature and time. The TG curve for the XMA shown in Figure 4, showed a thermal degradation occurs in three steps. The first step occurs between 150°C-250°C, a fast process with a mass loss of 54.17% was probably due to thermal decomposition of the compound with breaking of carboxylic acid linkage. The second step occurred between 250°C-300°C, where the mass loss of 8.319% was observed and the loss of 1.369% indicates the occurrence of the third step of degradation.
LCMS analysis
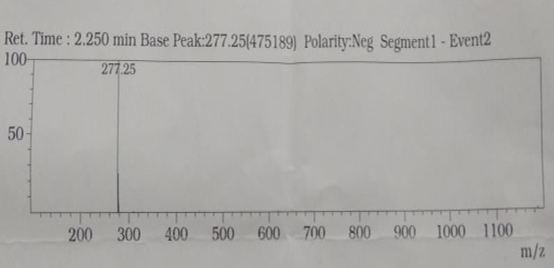
A mass spectrum is a plot of the relative abundance of a fragmented ion against the ratio of mass/charge of these ions. Using mass spectrometry, relative molecular mass (molecular weight) can be determined with high accuracy and an exact molecular formula can be determined with knowledge of places where the molecule has been fragmented. A molecular formula shows data. It is a single charged compound. The molecular weight of the structure mentioned is 278. So M/Z for the assigned molecular structure is 278 as charged on it is 1 shown in Figure 5. When LCMS did with an ESI source and single quadrupole analyzer, it is clearly shown M/Z is 277, which is negative ionization mode i.e., M-H.
|
Collagenase enzyme inhibition activity (Percentage %) |
|||
|---|---|---|---|
|
Concentration |
Negative Control |
STD Catechin |
Xymenynic acid |
|
10 ug/mL |
NA |
15.42 |
5.19 |
|
20 ug/mL |
NA |
30.99 |
15.11 |
|
30 ug/mL |
NA |
45.50 |
27.02 |
|
40 ug/mL |
NA |
61.22 |
37.86 |
|
50 ug/mL |
NA |
76.79 |
52.37 |
NMR analysis
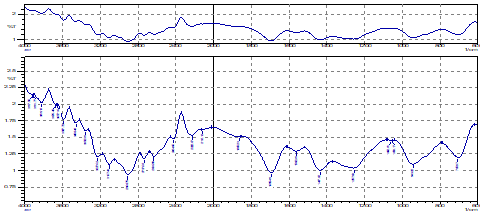
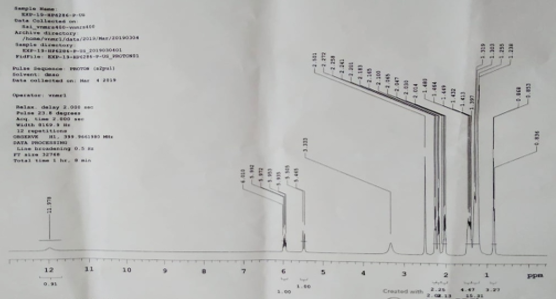
NMR is primarily related to the magnetic properties of certain atomic nuclei, notably the nucleus of the hydrogen atom, the proton, the carbon, and an isotope of carbon. NMR spectroscopy has enabled many researchers to study molecules by recording the differences between the various magnetic nuclei and thereby giving a clear picture of what the positions of these nuclei are in the molecule. Moreover, it will demonstrate which atoms are present in neighboring groups. Proton NMR spectrum is shown in Figure 6 indicates the presence of carboxylic acid proton atom at 11.978ppm. The NMR spectrum also indicates unsaturation at 6.010ppm and 5.505 ppm due to butylenic and methylene proton atom, respectively. Presence alkynyl proton atoms at chemical shift (∂) value of 2.501 ppm and 3.333ppm while 1.413ppm-2.272ppm chemical shift value indicates the presence of allylic proton atoms. The ∂ value of 0.836ppm-1.319ppm shows the presence of alkyl primary proton atoms in the molecule.
Anti-collagenase enzyme assay
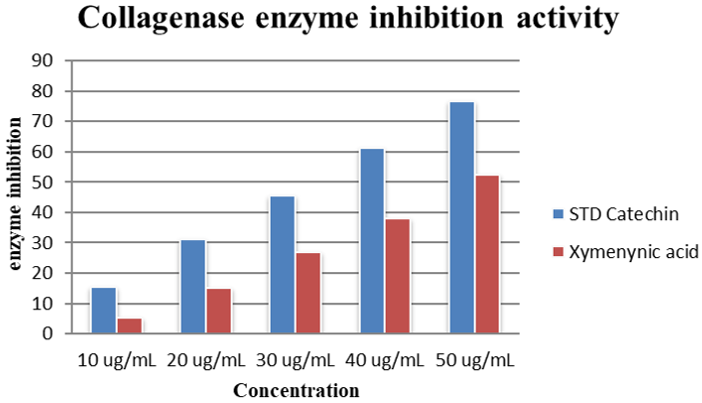
Collagen, the major component of the skin, is degraded by the enzyme collagenase. Inhibition of collagenase activity delays the process of forming pre-collagen fibers and, subsequently, the wrinkling process. Isolated XMA inhibited the enzyme by more than 50%, at a concentration of 50 ug/ml (Table 1 and Figure 7).
Conclusions
In the present research, the XMA was successfully isolated and purified from Santalum album seed. Chemical characterization and structural elucidation were done by FTIR, NMR and LCMS. The isolated XMA was pure crystalline powder and relatively stable below 150°C checked through DSC, XRD and TGA. XMA was successfully isolated in a pure crystal form and that isolated crystals were characterized by FTIR, DSC and TGA, indicating no impurities and were used for further phytochemical screening. While determining Structural properties, the XRD pattern of the isolated compound matched with the standard pattern of XMA and structure of XMA was confirmed as that of Xymenynic acid by 1D and 2D-NMR spectroscopic methods. Analysis of isolated XMA revealed its purity 99.1%, with a good yield value of 2% - 5% and considering the purity that was the acceptable range of the yield value of the isolated Xymenynic acid to be claimed as API. In addition, the results of antiaging activities suggested XMA had stronger antiaging activities in a concentration-dependent manner, which indicated that XMA had the potential as a novel natural antiaging in functional food. In future research, the detailed structure of XMA needs further study.
Authors’ contribution
Rakesh Shivatare, Ramesh Musale, Priya Lohakare and Dipika Patil's contribution included collecting samples, designing and performing laboratory work, whereas the Durga Choudhary, Dr. Gayatri Ganu analyzing the results, and preparing the paper. Dr. Dheeraj Nagore, Dr. Shailesh Kewatkar's contribution included data interpretation and identification of the compounds. All the authors have read the final manuscript and approved the submission.
Conflicts of interest
The authors declare no conflicts of interest.