Simultaneous estimation of ledipasvir and sofosbuvir in bulk and its dosage forms by stability indicating RP-HPLC method
Abstract
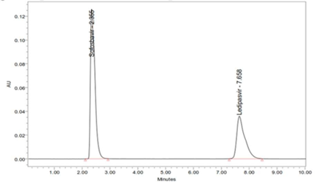
The fixed-dose ledipasvir-sofosbuvir combination offers an effective and well-tolerated pill for the treatment of chronic hepatitis C infection. Only a few analytical works were carried out to estimate the Ledipasvir and Sofosbuvir drug combination in the various dosage forms. This work aimed to simplify the estimation process using RP-HPLC methodology. The method was developed on a reversed phase Agilent C18 (4.6 x 150 mm, 5 µm) column. The isocratic elution process was performed using a mobile phase ratio of Methanol (70% v/v): Water (30 % v/v) with 0.6 ml/min flow rate. Elute was scanned using the PDA detector at the wavelength of 235 nm. The results of the elution process showed that the Ledipasvir and Sofosbuvir elute the peak at a concentration of 9 μg/ml and 40 μg/ml with retention times of 7.745 min and 2.345 min respectively. The percentage purity of Ledipasvir and Sofosbuvir was found to be 99.40 % w/v and 98.20 % w/v. The proposed method was found to be a high degree of precision and reproducibility. The percentage recovery was found to be 99.92 % for Ledipasvir and 99.82 % for Sofosbuvir. The LOD and LOQ were measured, and the results were within limits. The developed validation method can be applied for degradation evaluation of Ledipasvir and Sofosbuvir for the various dosage forms.
Keywords
RP-HPLC, Ledipasvir, Sofosbuvir, Stability Indicating
Introduction
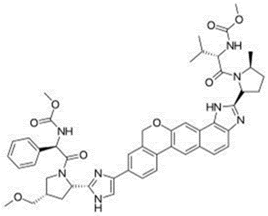
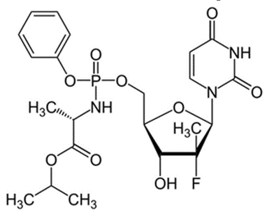
Ledipasvir is the first approved NS5A inhibitor agent for HCV genotype 1 treatment (Yasir, 2015), (Figure 1). The Ledipasvir possessed multiple hetero rings such as benzimidazole, imidazole, pyrrole, etc. It also contains the carbonyl amino, fluoro and carbamate groups. The pharmacokinetic parameter of the drug showed >99.8% protein binding, the plasma half-life of 47 hrs and the renal clearance of 1% (Devilal, Durgaprasad, Pal, & Rao, 2016). Sofosbuvir, secondhand agent for the combination therapy to treat chronic Hepatitis C with Ledipasvir (Keating, 2014), (Figure 2). It contains a furan ring in the center with the surrounding of various fragments of pyrimidine, phenoxy, phosphoryl amino and methyl group (Bandla & Ganapathy, 2017). Sofosbuvir found 61- 65 % of protein binding, 0.4 hr of plasma half-life and 80% renal clearance (Guguloth, Madhukar, Kanna, Ravinder, & Sravanthi, 2016). FDA approved the fixed dose combination of ledipasvir-sofosbuvir for the sustained virological response (Akshay, Rote, Alhat, & Kulkarni, 2017; Zaman, Siddique, & Hassan, 2016). The primary data revealed that the combination offers effective treatment of hepatitis C infection, and it is well tolerated in oral dosage forms. It is imperative to have safety and efficacy in drug therapy; pharmacists must take into consideration the stability of drugs and their therapeutic values. The stability of the drug formulations can be assessed by using stability indicating methods (Sreenivasa, Mandapati, & Sreenivasa, 2017). A well-designed stress study is important to help develop and demonstrate the specificity of stability indicating methods (Nebsen & Elzanfaly, 2016). They are also useful in checking rapid and accurate drug quality during stability testing (Ewing, 1997).
There is no cost-effective analytical method reported (consuming less amount of mobile phase) for simultaneous analysis of Ledipasvir and Sofosbuvir, previous to our work (Hassouna, Abdelrahman, & Mohamed, 2017; Kiran, Saisri, Priyanka, Subhashini, & Manikanta, 2017; Nagaraju, Vardhan, Kumar, & Chandran, 2017). The present work is aimed at to develop a novel, rapid, affordable, reliable, cost-effective, selective, sensitive, precise, accurate, reproducible, and specific analysis of combination (Ledipasvir and Sofosbuvir) in various dosage forms using stability indicating RP-HPLC method (Madhavi & Rani, 2017; Uppalapati, Jyothi, Parimi, & Umadevi, 2017; Yogendrachari, Madhu, Kumar, Kumari, & Naik, 2016).
Materials and Methods
Authentic drug samples of Ledipasvir and Sofosbuvir were obtained from Pharma Train Lab, Hyderabad. The commercial samples of the tablets Hepcinat-LP containing Ledipasvir - 90 mg and Sofosbuvir–400 mg were provided by Natco Pharmaceuticals Pvt.Ltd, Hyderabad. All the solvents were HPLC grade and purchased from the Sigma Aldrich.
|
Ledipasvir |
|||||
|---|---|---|---|---|---|
|
S.No |
Standard Area |
Sample Area |
Amt. Present (mg) |
Amt. Found (mg) |
% Assay |
|
1 |
708756 |
720705 |
90 |
89.9 |
99.89 % w/v |
|
2 |
710729 |
715103 |
90 |
89.8 |
99.7 % w/v |
|
3 |
713024 |
714243 |
90 |
88.9 |
98.7 % w/v |
|
Average Assay |
99.4 % w/v |
||||
|
Sofosbuvir |
|||||
|---|---|---|---|---|---|
|
S.No |
Standard Area |
Sample Area |
Amt. Present (mg) |
Amt. Found (mg) |
% Assay |
|
1 |
1394581 |
1408375 |
400 |
399.89 |
99.9 % w/v |
|
2 |
1394685 |
1394807 |
400 |
389.9 |
97.4 % w/v |
|
3 |
1395686 |
1391570 |
400 |
388.98 |
97.25 % w/v |
|
Average Assay |
98.20 % w/v |
||||
Chromatographic process and conditions
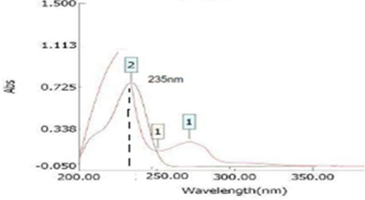
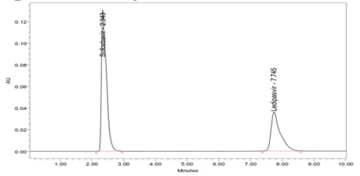
Waters e2695 Separation Module HPLC autosampler system and a UV-visible detector were used for the chromatographic separation.The chromatographic column utilized in the study was Agilent C18 (4.6 × 150 mm, 5µm). Different mobile phases were tried, and the one containing Methanol: Water in the ratio of 70: 30 % v/v was appropriate. The mobile phase was used as a diluent. The flow rate selected was 0.6 ml/min. The overlay spectrum of Ledipasvir and Sofosbuvir was obtained, and the isobestic point of Ledipasvir and Sofosbuvir showed absorbance's maxima at 235 nm (Rai, Prajapati, & Patni, 2017), (Figure 3).
Preparation of Mixed Standard and sample Solutions of Ledipasvir Sofosbuvir
Accurately weighed pure drugs of Ledipasvir 90 mg and 400 mg of Sofosbuvir for working standard preparation and 20 ml of diluent (methanol: water) was added in 100 mL standard flask. Further, it was sonicated and made up to the volume. The final concentration of 9.0 µg/ml Ledipasvir and 40.0 µg/ml Sofosbuvir was prepared from the stock solution. Similarly, the marketed sample Hepcinat-LP tablets with the label claim of 90 mg of Ledipasvir and 400mg Sofosbuvir was powdered and placed into a 100 ml volumetric flask. The sample solution is prepared as a similar standard concentration of 9.0 µg/ml Ledipasvir and 40.0 µg/ml Sofosbuvir, respectively.
Assay
Initially, 10μl of standard solution and simultaneously sample solution was injected and the peak areas of the drugs in standard and sample compared. Ledipasvir and Sofosbuvir show the percentage purity values of 99.40 % w/v and 98.20 % w/v respectively (Table 2; Table 1).
|
Parameters |
Ledipasvir |
Sofosbuvir |
|---|---|---|
|
Linear Dynamic Range |
7.2 – 10.8 μg/ml |
32 – 48 μg/ml |
|
Correlation Coefficient |
0.999 |
0.999 |
|
Slope (m) |
49116 |
52816 |
Results and Discussion
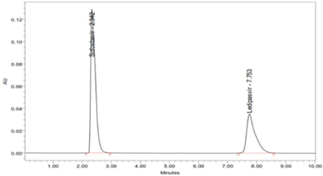
Specificity
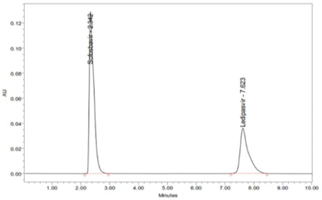
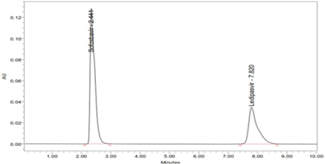
There are no elutions of interfering peak takes place, which shows that the peak of the analyte was pure, and excipients in the combination do not interfere with the analyte (Figure 4). Therefore, the method is specific and selective for the estimation of Ledipasvir and Sofosbuvir in the combination.
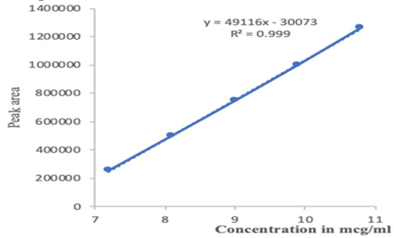
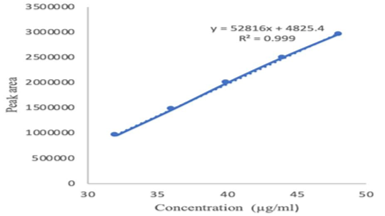
Linearity and Range
Linearity and range measured for the working standard by the various diluted concentration of 7.2, 8.1, 9.0, 9.9 and 10.8 μg/ml for Ledipasvir and 32,36,40,44 and 48μg/ml for Sofosbuvir respectively. From the results of linearity studies, the specified range was determined for Ledipasvir & Sofosbuvir given as 7.2 – 10.8 μg/ml and 32 μg/ml – 48 μg/ml (Table 3). The calibration curves are shown in (Figure 6; Figure 5). The Correlation Coefficient for Ledipasvir & Sofosbuvir was found to be within the acceptance criteria of 0.999.
|
Injection |
Rt |
Peak Area |
USP Plate count |
USP Tailing |
|---|---|---|---|---|
|
1 |
7.839 |
718391 |
2760 |
1.74 |
|
2 |
7.832 |
724000 |
2750 |
1.73 |
|
3 |
7.774 |
715765 |
2735 |
1.74 |
|
4 |
7.753 |
716230 |
2673 |
1.72 |
|
5 |
7.745 |
717222 |
2763 |
1.75 |
|
6 |
7.746 |
716181 |
2765 |
1.76 |
|
MEAN |
7.781 |
717964.83 |
2741 |
1.74 |
|
SD |
0.0432 |
3104.44 |
35.105 |
0.0141 |
|
% RSD |
0.554 |
0.432 |
1.281 |
0.813 |
|
Injection |
Rt |
Peak Area |
USP Plate count |
USP Tailing |
|---|---|---|---|---|
|
1 |
2.358 |
1394821 |
2550 |
1.81 |
|
2 |
2.355 |
1392238 |
2554 |
1.79 |
|
3 |
2.344 |
1394221 |
2544 |
1.79 |
|
4 |
2.343 |
1403835 |
2498 |
1.80 |
|
5 |
2.345 |
1394286 |
2492 |
1.78 |
|
6 |
2.350 |
1404803 |
2540 |
1.84 |
|
MEAN |
2.349 |
1397367 |
2529.667 |
1.80 |
|
SD |
0.006 |
5464.572 |
27.347 |
0.021 |
|
% RSD |
0.266 |
0.391 |
1.08 |
1.186 |
|
S.No |
Sample name |
Rt |
Peak Area |
% Assay-Ledipasvir |
|---|---|---|---|---|
|
1 |
Ledipasvir |
7.804 |
702828 |
99.85 |
|
2 |
Ledipasvir |
7.832 |
703012 |
99.87 |
|
3 |
Ledipasvir |
7.765 |
703168 |
99.89 |
|
4 |
Ledipasvir |
7.753 |
702986 |
99.87 |
|
5 |
Ledipasvir |
7.745 |
704265 |
100.05 |
|
6 |
Ledipasvir |
7.668 |
704878 |
100.14 |
|
Mean |
7.761 |
703522.8 |
99.945 |
|
|
SD |
0.056 |
842.037 |
0.120 |
|
|
%RSD |
0.726 |
0.120 |
0.120 |
|
S.No |
Sample name |
Rt |
Peak Area |
% Assay- Sofosbuvir |
|---|---|---|---|---|
|
1 |
Sofosbuvir |
2.345 |
1399343 |
99.75 |
|
2 |
Sofosbuvir |
2.360 |
1408881 |
100.43 |
|
3 |
Sofosbuvir |
2.343 |
1410142 |
100.52 |
|
4 |
Sofosbuvir |
2.342 |
1403270 |
100.03 |
|
5 |
Sofosbuvir |
2.341 |
1398220 |
99.67 |
|
6. |
Sofosbuvir |
2.34 |
1401224 |
99.88 |
|
Mean |
2.345 |
1403513 |
100.05 |
|
|
SD |
0.007 |
4969.153 |
0.355 |
|
|
%RSD |
0.318 |
0.354 |
0.354 |
|
Days |
Ledipasvir |
Sofosbuvir |
||
|---|---|---|---|---|
|
Rt |
Peak Area |
Rt |
Peak Area |
|
|
Day 1* |
7.886 |
721335 |
2.351 |
1409240 |
|
Day 2* |
7.879 |
724937 |
2.350 |
1408068 |
|
Day 3* |
7.723 |
717532 |
2.346 |
1397300 |
|
Day 4* |
7.690 |
719255 |
2.345 |
1393047 |
|
Day 5* |
7.683 |
718995 |
2.345 |
1401990 |
|
Day 6* |
7.648 |
716548 |
2.345 |
1400851 |
|
MEAN |
7.751 |
719767 |
2.347 |
1401749.333 |
|
SD |
0.1042 |
3013.39 |
0.0027 |
6203.67 |
|
% RSD |
1.344 |
0.418 |
0.117 |
0.442 |
*Average of six injections
System precision
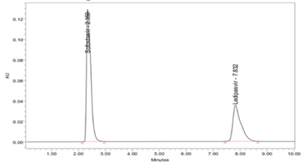
Six replicate injections of a mixed standard solution of Ledipasvir (9.0 µg/ml), and Sofosbuvir (40.0 µg/ml) was used to measure the system precision. The R.S.D [%] of peak area was 0.432, retention time was 0.554, U.S.P Plate count was 1.281 and U.S.P tailing of 0.813 for Ledipasvir. The R.S.D (%) of peak area was 0.391; retention time was 0.266, U.S.P Plate count 1.08 and USP tailing of 1.186 for Sofosbuvir. The reports revealed that all the system parameters were found within the Acceptance criteria of 2 %. The results are reported in Table 5; Table 4. The chromatograms are shown in (Figure 7).
Method Precision
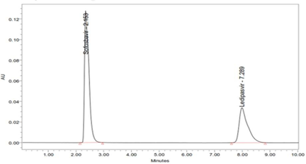
In the same way, method precision was determined by six repeat injections of a mixed combination of the sample solution of 9.0 µg/ml Ledipasvir and 40.0 µg/ml Sofosbuvir. The Table 6; Table 5 elucidated the percentage RSD of peak area was 0.120, Rt of 0.726 and assay of 0.120 for Ledipasvir. The % R.S.D of peak area was 0.354; retention time was 0.318 and assay was 0.354 for Sofosbuvir. The method precision results showed that the obtained values are in the acceptance criteria of 2 % (Table 7; Table 6). The chromatograms are shown in (Figure 8). Thus, the proposed method was found to be a high degree of precision and reproducibility.
|
Parameters |
Ledipasvir |
Sofosbuvir |
|---|---|---|
|
Tailing factor |
1.74 |
1.80 |
|
Resolution |
6.42 |
|
|
Retention time |
7.745 |
2.343 |
|
Theoretical plates per unit |
2741 |
2529.7 |
Inter-day Precision
To check the inter-day variations of the method, the same concentration of Ledipasvir and Sofosbuvir were subjected to the proposed HPLC method of analysis on different days, and the results obtained were noted. The R.S.D % of peak area was 0.4186 and retention time was 1.344 for Ledipasvir. The R.S.D % of peak area was 0.442 and retention time was 0.117 for Sofosbuvir. Statistical evaluation revealed that parameters found were within the acceptance range of R.S. D<2% (Table 8). Thus, the proposed method was found to have a high degree of precision and reproducibility.
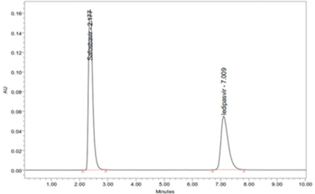
System Suitability
To elucidate the system suitability, six repeated injections of a mixed standard solution of Ledipasvir & Sofosbuvir was injected. The parameters including resolution, tailing factor, no. of theoretical plates were mainly used to assess system suitability. Table 9 and Figure 9 showed tailing factor for Ledipasvir & Sofosbuvir was found to be 1.74 and 1.80, respectively. The Theoretical plates per unit for Ledipasvir & Sofosbuvir was found to be 2741 and 2529.7 respectively. The resolution value of Ledipasvir & Sofosbuvir was found to be 6.42. The chromatograms are shown in (Figure 9).
|
%Concentration (at specification level) |
Sample Area |
Amount added (μg) |
Amount found (μg) |
% Recovery |
Mean recovery |
|---|---|---|---|---|---|
|
7.2 μg/ml |
573624 |
7.2 |
7.19 |
99.86 |
|
|
572348 |
7.2 |
7.10 |
98.61 |
99.11 % |
|
|
572564 |
7.2 |
7.12 |
98.88 |
||
|
9.0 μg/ml |
717859 |
9.0 |
9.10 |
101.11 |
|
|
717033 |
9.0 |
8.98 |
99.77 |
100.40 % |
|
|
720136 |
9.0 |
9.03 |
100.33 |
||
|
10.8 μg/ml |
860784 |
10.8 |
10.81 |
100.09 |
|
|
864542 |
10.8 |
10.84 |
100.37 |
100.24 % |
|
|
863652 |
10.8 |
10.83 |
100.27 |
||
|
Average recovery |
99.92 % |
|
%Concentration (at specification level) |
Sample Area |
Amount added (μg) |
Amount found (μg) |
% Recovery |
Mean recovery |
|---|---|---|---|---|---|
|
32.0 μg/ml |
1119764 |
32 |
31.76 |
99.25 |
|
|
1127984 |
32 |
32.10 |
100.31 |
99.39 % |
|
|
1112438 |
32 |
31.56 |
98.62 |
||
|
40.0 μg/ml |
1402055 |
40 |
40.06 |
100.15 |
|
|
1399863 |
40 |
40.02 |
100.05 |
100.04 % |
|
|
1399038 |
40 |
39.97 |
99.92 |
||
|
48.0 μg/ml |
1679761 |
48 |
47.97 |
99.93 |
|
|
1680213 |
48 |
48.04 |
100.08 |
100.03 % |
|
|
1682110 |
48 |
48.05 |
100.10 |
||
|
Average recovery |
99.82 % |
|
S.No |
Parameters |
Ledipasvir |
Sofosbuvir |
||
|---|---|---|---|---|---|
|
USP Plate Count |
USP Tailing |
USP Plate Count |
USP Tailing |
||
|
1 |
Actual method |
2741.0 |
1.74 |
2529.6 |
1.80 |
|
2 |
Changes in the flow rate (0.4 ml/min) |
2890.0 |
1.72 |
2313.2 |
1.82 |
|
3 |
Changes in the flow rate (0.8 ml/min) |
2563.1 |
1.71 |
2684.0 |
1.74 |
|
4 |
Changes in the Organic phase composition in the mobile phase (5 % less) |
2867.0 |
1.70 |
2356.0 |
1.81 |
|
5 |
Changes in the Organic phase composition in the mobile phase (5 % more) |
2654.4 |
1.61 |
2231.4 |
1.82 |
|
Parameters |
% RSD Area- Ledipasvir |
% RSD Area- Sofosbuvir |
|---|---|---|
|
Analyst 1 |
0.43 |
0.39 |
|
Analyst 2 |
0.27 |
0.54 |
|
Drug name |
Standard deviation(σ) |
Slope(s) |
LOD(µg) |
LOQ(µg) |
|---|---|---|---|---|
|
Ledipasvir |
3104.0 |
49116 |
0.208 |
0.631 |
|
Sofosbuvir |
5464.5 |
52816 |
0.341 |
1.034 |
|
S.No |
Name |
Sample weight |
% Assay- Ledipasvir |
% Assay- Sofosbuvir |
% DEG- Ledipasvir |
% DEG- Sofosbuvir |
|---|---|---|---|---|---|---|
|
1 |
Acid |
590 |
88 |
90 |
- 12 |
-10 |
|
2 |
Base |
590 |
89 |
88 |
-11 |
-12 |
|
3 |
Peroxide |
590 |
97 |
94 |
- 3 |
- 6 |
|
4 |
Water |
590 |
85 |
94 |
- 15 |
-6 |
|
5 |
Light |
590 |
96 |
95 |
-4 |
-5 |
Accuracy
The targeted concentration of 7.2 µg/ml, 9.0 µg/ml and 10.8 µg/ml of Ledipasvir & 32 µg/ml, 40 µg/ml and 48 µg/ml of Sofosbuvir working standards were spiked with Placebo and each injected thrice. The Mean recovery for Ledipasvir & Sofosbuvir was found to be 99.92 % and 99.82 % v respectively. The obtained mean recovery values were present within the acceptance limits of 98 - 102 %. The results are reported in Table 11; Table 10.
Robustness
It was performed changing the HPLC pump flow rate variations ± 0.2 ml/min and organic composition of the mobile phase ±5%. U.S.P Plate count and U.S.P tailing were found to be 2890.0 and 1.72 for 0.4 ml/min flow rate for Ledipasvir. U.S.P Plate count and U.S.P tailing were found to be 2563.1 and 1.71 for 0.8 ml/min flow rate for Ledipasvir. U.S.P Plate count and U.S.P tailing were found to be 2313.2 and 1.82 for 0.4 ml/min flow rate for Sofosbuvir. U.S.P Plate count and U.S.P tailing were found to be 2684 and 1.74 for 0.8 ml/min flow rate for Sofosbuvir. U.S.P Plate count and U.S.P tailing were found to be 2867 and 1.70 for 5% less organic composition in mobile phase for Ledipasvir. U.S.P Plate count and U.S.P tailing were found to be 2654.4 and 1.61 for 5% more organic composition in mobile phase for Ledipasvir. U.S.P Plate count and U.S.P tailing were found to be 2356 and 1.81 for 5% less organic composition in mobile phase for Sofosbuvir. U.S.P Plate count and U.S.P tailing were found to be 2231.4 and 1.82 for 5% more organic composition in mobile phase for Sofosbuvir. No changes were observed in chromatograms when changing the flow rate and the concentration of the mobile phase. The chromatograms are shown in (Figure 13; Figure 12; Figure 11; Figure 10) and results are reported in Table 12.
Ruggedness
Mixed standard solution of Ledipasvir & Sofos- buvir was prepared by adding diluent as per test method separately by Analyst – I and Analyst – II. 10 µl of these solutions were injected for six times and the % RSD for the Peak area of six replicate injections were calculated for Analyst – I and Analyst - II. The % R.S.D of Peak area for Analyst I and Analyst II was found to be 0.43 and 0.27 for Ledipasvir. The % R.S.D of Peak area for Analyst I and Analyst II was found to be 0.39 and 0.54 for Sofosbuvir. The % R.S.D of peak area was present within the acceptance criteria of 2%. The low values of the % RSD, indicate the ruggedness of the proposed methods (Table 13).
Estimation of LOD and LOQ
LOD= 3.3xσ/S; LOQ=10Xσ/S
The LOD of Ledipasvir and Sofosbuvir were 0.208 µg/ml and 0.341 µg/ml. The obtained LOD values were very less when equated to the reported method. As per the analytical point of view, the method detects the very least quantity. So when compared to the reported methods, the developed method is most suitable to detected less quantity. The LOQ of Ledipasvir and Sofosbuvir were 0.631 µg/ml and 1.034 µg/ml, respectively. The obtained LOQ values were very less when compared to reported methods. As per the analytical point of view, the method detected the very least quantity. So when compared to the reported methods, the developed method is most suitable to detect less quantity. The results are reported in Table 14.
Degradation studies
Acidic Degradation
The sample solution was prepared with 10 ml of 0.01 M Hydrochloric acid. Reflux under heat at 60°C for one hour. The sample solution was neutralized using 0.01 M Sodium hydroxide and diluted with diluent to make the final concentration as per test method.
Basic Degradation
The sample solution was prepared with 10 ml of 0.1 M Sodium hydroxide. Reflux under heat at 60°C for one hour. The sample solution was neutralized using 0.1 M Hydrochloric acid and diluted with diluent to make the final concentration as per test method.
Neutral Degradation
The sample solution was prepared with10 ml of water. Reflux under heat at 60°C for one hour. The sample solution was diluted with diluent to make the final concentration as per test method.
Oxidative Degradation
The sample solution was prepared with 10 ml of 3 % Hydrogen perox- ide. Reflux under heat at 60°C for one hour. The sample solution was diluted with diluent to make the final concentration as per test method.
Photolytic Degradation
The sample solution for photolytic stability studies was prepared with diluent as per test method. The test solution was exposed to natural sunlight for 8 hours. Results of the degradation studies indicated that the Ledipasvir is slightly not stable in neutral, acidic and basic conditions and stable in oxidative and photolytic. Sofosbuvir is slightly not stable in basic and acidic degradation and stable in neutral, oxidative and photolytic degradation. The results are reported in Table 15.
Conclusion
An analytical method was developed and validated by RP-HPLC technique. It consumes less amount of mobile phase, and the required time for analysis is very short. The method was applied for the determination of the potency of the commercial product of Ledipasvir and Sofosbuvir and potency were found within the limit. The results of assay analysis of two drugs from a combined dosage form using this developed method were found to be close to 100 %. The projected method was specific as no interference of excipients was found. The information given in the study will be very useful in quality control, content uniformity test, in-vitro dissolution of the combination of Ledipasvir and Sofosbuvir drug products. The developed method can be efficiently applied for the separation of the drugs from its excipients and its degradation components in the pharmaceu- tical formulation. It can be used to check rapid and accurate drug quality during stability testing.
Acknowledgements
The authors are very much thankful to the Crescent School of Pharmacy, B.S. Abdur Rahman Crescent Institute of Science and Technology, Chennai, India for providing essential services to carry out the study.