Evaluation of anti bacteria effects of citrate-reduced silver nanoparticles in Staphylococcus aureus and Escherichia coli
Abstract
Silver nanoparticles (AgNPs) has long known for its inhibitory and bactericidal effects. However, due to its attractive antibacterial property, on-going research with various synthesis strategies actively been conducted. In this study, the synthesis of AgNPs was reported, using a simple chemical reduction method with citrate as the reducing agent. TEM was used to characterize the obtained AgNPs. Then, Staphylococcus aureus and Escherichia coli were used to identify the antibacterial activity of AgNPs. The inhibition effects of AgNPs against these two bacteria were observed via disc diffusion, and MIC assays and the effects of AgNPs mode of action on both bacteria were further observed under TEM. The formation of AgNPs at ̴ 400 nm, which is the surface plasmon resonance peak was observed using UV-vis spectroscopy. The size of AgNPs mostly in the range of 1-10 nm and their morphology appeared to be spherical. Based on the MIC assay, Escherichia coli exhibit low MIC value with 0.049 mg/ml as compared to Staphylococcus aureus with 0.391 mg/ml MIC value; correspond to the effective antibacterial activity by the citrate-reduced AgNPs. Further observation on the bacterial surface structure can be seen with cross-sectional TEM image, and it provides an insight into the AgNPs mechanistic aspects of AgNPs against Staphylococcus aureus and Escherichia coli. Silver nanoparticles have been successfully synthesized using the citrate reduction method. Results obtained in this study thus elucidating promising findings to employed AgNPs as an antibacterial agent, and this composition needs to be further study and develop into an antibacterial agent.
Keywords
AgNPs, chemical reduction method, antibacteria mode of action, Staphylococcus aureu, Escherichia coli, Silver nanoparticles
Introduction
The study of silver nanoparticles (AgNPs) has governed a broad extension in many years as it been widely known for the antibacterial property. The increasing incidents of bacterial resistance to classic antibiotics had contributed to high interest in the investigation of the antibacterial activity of silver nanoparticle (Martínez-Castañón, Niño-Martínez, Martínez-Gutierrez, Martínez-Mendoza, & Ruiz, 2008; Shahverdi, Fakhimi, Shahverdi, & Minaian, 2007), despite to the fact that the antibacterial activity of silver species has been established and used since ancient times (Holt & Bard, 2005). Thus, it is seen as a favor solution in the antibiotic-resistant study, as it also been demonstrated that silver is nontoxic to human cells in low concentrations. To date, it has been widely used in biomedical applications (Al-Ogaidi, 2017), electronics (Ahamed, Alsalhi, & Siddiqui, 2010), cosmetics (Gajbhiye & Sakharwade, 2016), care products (Lara, Garza-Treviño, Ixtepan-Turrent, & Singh, 2011) and food product packaging (Tankhiwale & Bajpai, 2009).
In the past few years, researchers have garnered much information on the AgNPs effects on the antimicrobial and cytotoxicity (Al-Ogaidi, 2017; Satyavani, 2012). Due to the smaller size of nanoparticles, it has additional potential as an antimicrobial agent which is not being shown by ionic silver. The small size and large surface to volume ratios of nanoparticles, has led both chemical and physical differences in their properties compared to their bulk counterparts (Shahverdi et al., 2007). Generally, the interactions of AgNPs with bacteria are dependent on the physical of the compound, which includes size and shape (Pal, Tak, & Song, 2007) where smaller nanoparticles exhibit better antimicrobial activity (Agnihotri, Mukherji, & Mukherji, 2014). Therefore, researchers attempted to produce AgNPs with an improved antibacterial activity using various synthesis approaches which includes chemical, physical and biogenic method. Based on the previously reported study, chemical reduction method is the most widely used method for the synthesis. This method has been widely studied since it has some advantages of producing a minimal aggregation of nanoparticles is has a high yield, and the preparation cost is low (Awad, Hendi, Ortashi, Alotaibi, & Sharafeldin, 2016). Generally, a strong reducing agent such as sodium borohydride (NaBH4) is utilized to generate instant nuclei, resulting in the formation of small-sized and uniform monodispersed AgNP (Agnihotri et al., 2014).
This study aims to investigate the antibacterial effects of AgNPs. This study will be focusing on synthesizing nanoparticles using citrate as the reducing agent. We also attempt to observe the AgNPs mode of action in Gram-negative and Gram-positive bacteria which could provide a view on the mechanistic aspect on the AgNPs inhibition and bactericidal effects.
Materials and Methods
Chemical synthesis of citrate-reduced AgNPs
Chemical synthesis of AgNPs method was adapted from (Khatoon, Rao, Mohan, Ramanaviciene, & Ramanavicius, 2017). The ratio of AgNO3 to trisodium citrate was fixed at 10: 1. Twenty-five mL of ddH2O mixed with twenty-five mL of trisodium citrate solution (0.02 M) and the mixture was heated at 70 °C and was stirred for 10 min. Then, AgNO3 solution (0.002 M) titrated as one drop per 3 secs, and the temperature was increased to 80 °C.
Characterization of the synthesized AgNPs
The synthesized AgNPs was observed via UV-Vis spectra (Shimadzu UV-1800) with the wavelength between 300 to 800 nm. The sharp peaks observed at 400 nm was recorded. The size and morphology of the synthesized AgNPs were analyzed at 120kV using transmission electron microscope (TEM). The AgNPs solution was dropped on a 3 mm copper grid and was left until dry. The particle size distribution and morphology were observed, and the images were processed using the FEI CM12 (version 3.L) image analysis system. Cell viability was measured using the ELISA reader (Multiskan spectrum).
Extraction, purification and sterilization of AgNPs
The AgNPs precipitates were obtained by using the freeze-drying method with some modification (Pal et al., 2007; Sondi & Salopek-Sondi, 2004). Initially, the AgNP solution was subjected to -20 ℃ freezers for 12 hrs. Then, the tube was placed in the freeze-drying machine (Labconco Freezone). The freeze-dried precipitate was suspended in ddH2O and the solution centrifuged at 3800 rpm for 10 minutes in order to remove any excess reactants. The pelleted AgNPs was suspended with ddH2O, and this step was repeated twice. The purified AgNPs was further sterilized using ethanol to obtain a volume of 1: 9 (v/v) AgNPs to ethanol. Five mL of purified AgNPs (50 mg/mL) were mixed with 45 mL of 75 % ethanol. Then, the mixture brought to vortex for 15 secs and left at room temperature in a dark box for an hour and continued for centrifugation for 10 minutes at 3800 rpm. The excess ethanol was discarded, and the AgNPs composition was air-dried. Finally, the sterilized and air-dried AgNPs was weighed and diluted to 200 mg/ml using sterilized ddH2O and was kept in the dark.
Antibacterial Assay
Disc diffusion test
Escherichia coli (ATCC 25922) and Staphylococcus aureus (ATCC 12600) were used in the antibacterial assay. About 10 µl of AgNPs solution using different concentrations were pipetted to the disc. The concentration tested were (50 mg/ml, 100 mg/ml, 150 mg/ml and 200 mg/ml). The discs impregnated with different concentration were placed on the surface of the bacteria on agar plates. Ten µL of chloramphenicol 10 mg/mL concentration was pipetted to the disc as a positive control, and 10 µL of sterilized dH2O was pipetted to the disc as a negative control. Then, the inoculated agar plates were incubated at 37 ˚C for 20 hours. After incubation, the diameter of the zone of inhibition on incubated agar plates were measured and recorded.
Minimum inhibitory concentration assay (MIC)
Minimum inhibitory concentrations (MIC) were determined by using serial dilution method. The MIC method was adapted from (Caviedes, Delgado, & Gilman, 2002) with slight modification. A 16 hours bacteria culture was diluted with a sterile physiologic saline solution [PS; 0.85% (w/v) sodium chloride] with reference to the 0.5 McFarland standards to achieve inoculums approximately 106 colony-forming unit (cfu)/mL. Two-fold serial dilution was carried out to give a final concentration between 25 mg/mL to 0.012 mg/mL. The microtitre plates were inoculated with 20 µL of the bacterial suspension per ml nutrient broth, homogenized, and incubated at 37 ºC. The MIC value determined as the lowest concentration that inhibits the growth of bacteria.
Observation of AgNPs antibacterial mode of action
The method by (Li et al., 2010) and (Li et al., 2011) was adopted and modified to test on the antibacterial mode of action. Muller Hinton (MH) broth, AgNP solution and bacteria cells (S. aureus and E. coli) were added to the Falcon Tube. The resulting final concentration of AgNPs in the tube was 0.5 mg/ml, and the bacteria concentration was 108 cfu/mL. The steps follow with incubation at 37 °C in the rotatory incubator at 200 rpm for 6 hours. Then, the cells were centrifuged, and the cell pellet was stained with tetraosmium oxide. The stained cells were impregnated in resin and further incubated for a week. Finally, the resin was sliced into a thin layer using microtome, and the bacterial cells images were observed using TEM.
Results and Discussion
Size and morphology of AgNPs
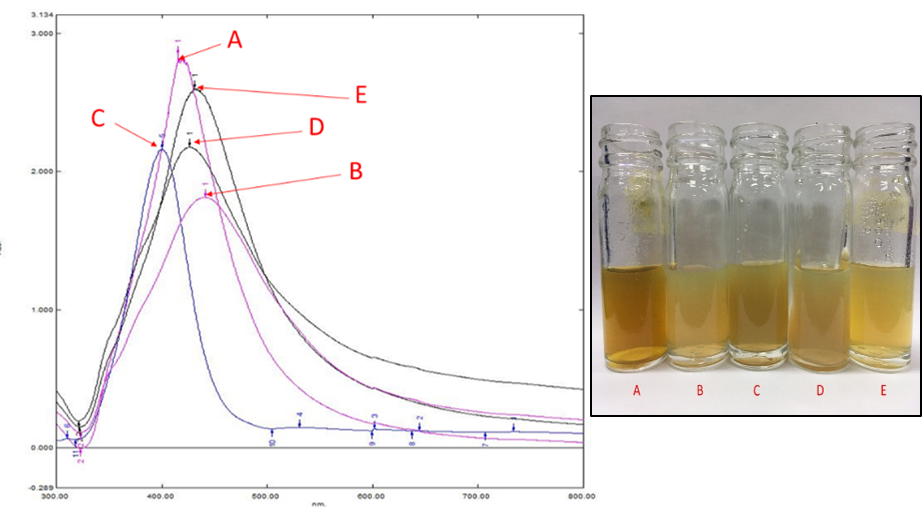
An initial observation using UV-Vis spectra in Figure 1 shows a sharp peak observed at 400 nm, and this is corresponded to the formation of AgNPs. The peak implies the AgNPs surface plasmon resonance (SPR), a common property for the noble metal nanoparticles. The reaction mixture from different synthesis batch (inset image in Figure 1) shows various color intensity (yellowish to a brownish colour) suggesting the production variation in the citrate reduction method. However, the obtained SPR peaks of the AgNPs samples (A - E) lies around 416 to 441 nm, within the accepted range as in (Ahmad et al., 2016). It appears that AgNP with a strong and sharp extinction peak can be observed at 380-420 nm in an optical experiment.
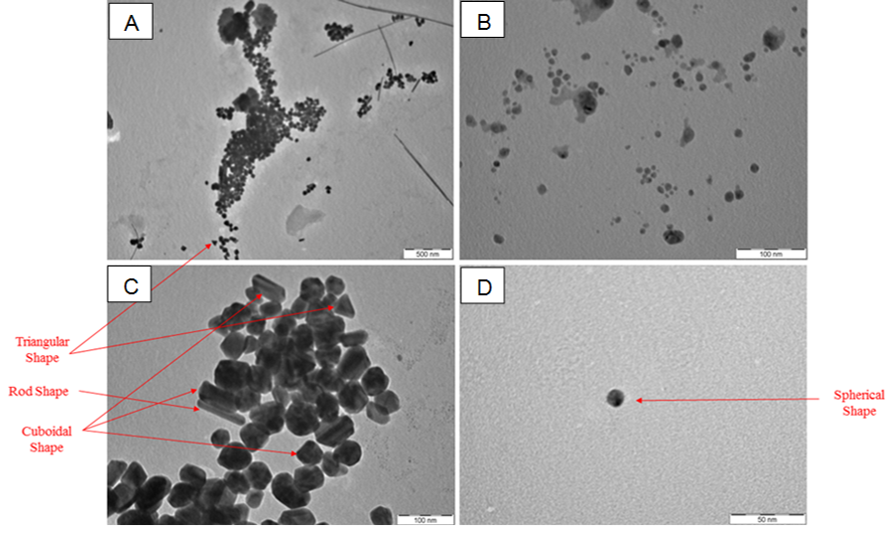
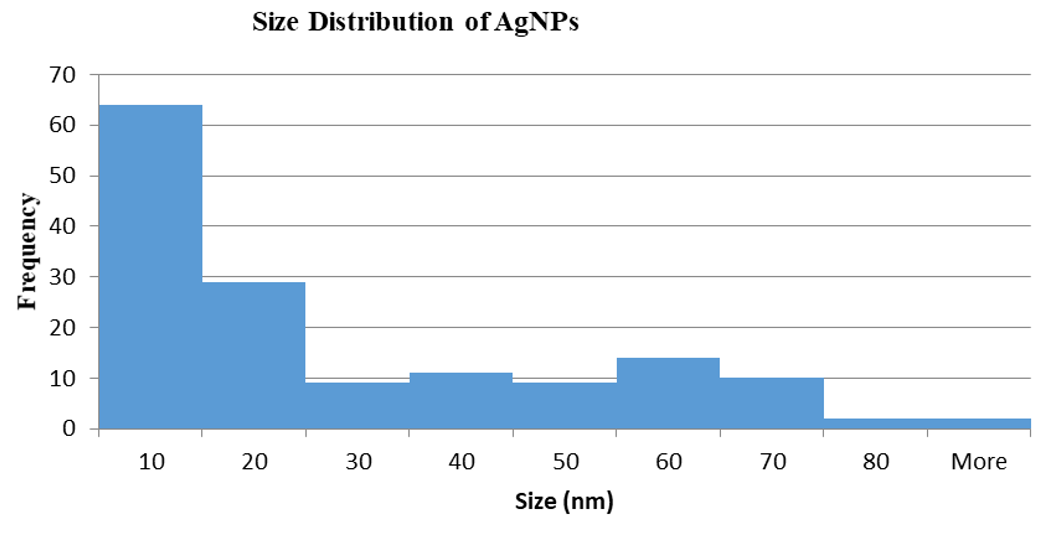
The size and morphology of citrate-reduced AgNPs was viewed under TEM. This characterization method displayed the formation of AgNPs with a different type of morphologies and sizes. Based on four different images presented in Figure 2 (A - D), several morphologies such as triangular, rod, cuboidal and spherical shape were observed. However, the spherical shape was observed more compared to the rest. Figure 3 shows, AgNPs size detected was in the range of 1-10 nm where. This is considered a minimum size range for AgNPs (Prabhu & Poulose, 2012). Only a few particles were measured above 20 nm and in agreement with the absorption spectra findings. Thus, the chemical reduction synthesis method using citrate as the reducing agent produces a narrow size distribution and uniform spherical morphology.
Furthermore, we also observed that the synthesized AgNPs showed a minimal nanoparticles aggregation due to the presence of citrate that also serves as the protective layer surrounding the AgNPs. This protective layer helps to avoid nanoparticles collision and eventually producing more uniform size and morphology. It is also observed that the citrate reduction method generate large AgNPs with a larger size range (more than 80 nm) as reported in (Agnihotri et al., 2014) and (Pyatenko, Yamaguchi, & Suzuki, 2007).
|
Bacteria |
MIC of AgNPs (mg/ml) |
|---|---|
|
Staphylococcus aureus |
0.391 |
|
Escherichia coli |
0.049 |
Assessment for antibacterial effects
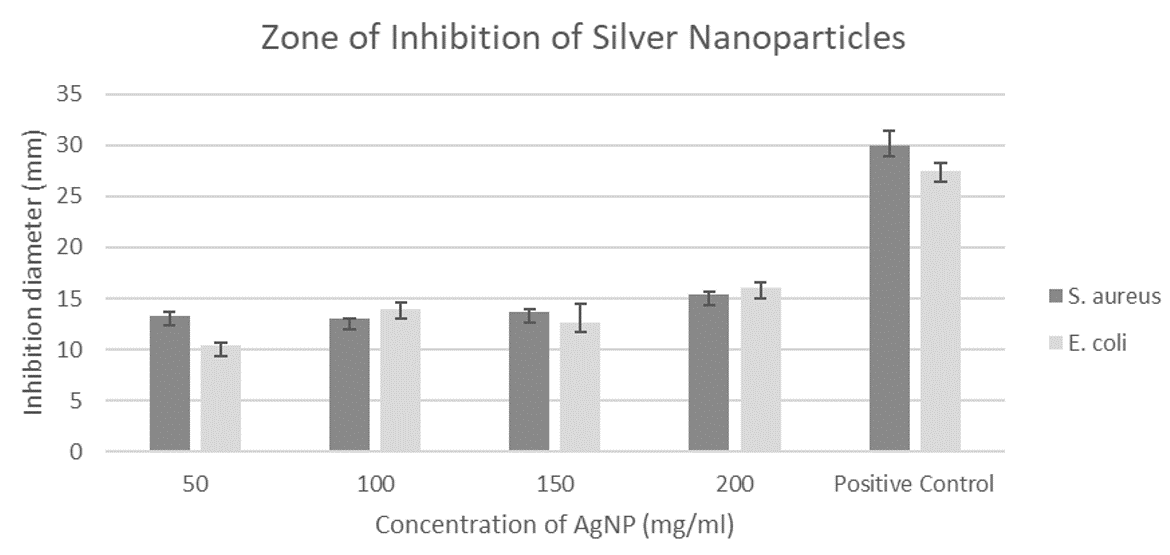
The antibacterial effects of AgNPs were determined by the presence or absence of bacterial inhibition zones. Different concentration of AgNPs was used to test against S. aureus and E. coli. And displayed a reasonable inhibition effects. The zone of inhibition was significant between the AgNPs samples and chloramphenicol (control) as depicted in Figure 4. However, no correlation can be found between the different concentration of AgNPs (50 mg/mL, 100 mg/mL, 150 mg/mL and 200 mg/mL) as the diameter of inhibition zone does not increase with increasing concentration and were measured to be around 10 to 16 mm. Although the disc diffusion test commonly used for antibacterial assessment for AgNPs, the diffusivity rate of AgNPs through solid agar medium is still undefined. There are several factors that could effect the accuracy of antibacterial test which the nature of the agar, thickness, and uniformity, temperature, inhibition zone size cut-off points. The concentration used need to be optimized with the lower concentration, as suggested by Jyoti, Baunthiyal, and Singh (2016). They suggested testing with concentrations ranging from 0.05 to 0.45 mg/ml. MIC assay was conducted for determination of AgNPs minimal inhibition concentration value. This assay further confirmed the existence of inhibitory effects of the synthesized AgNPs with E. coli that exhibited significant low concentration MIC value of 0.049 mg/ml as compared to S. aureus with MIC value of 0.391 mg/ml (Table 1). More detail observation on the mechanistic aspect of AgNPs using TEM image should provide insight into the inhibition process between these two types of bacteria.
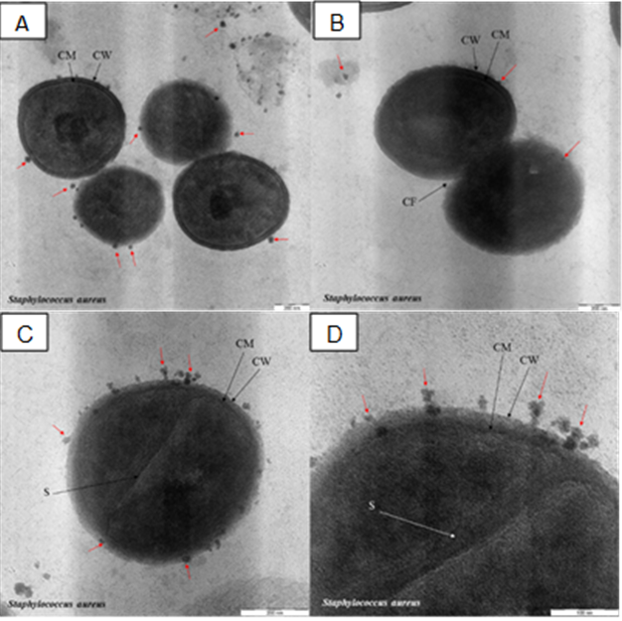
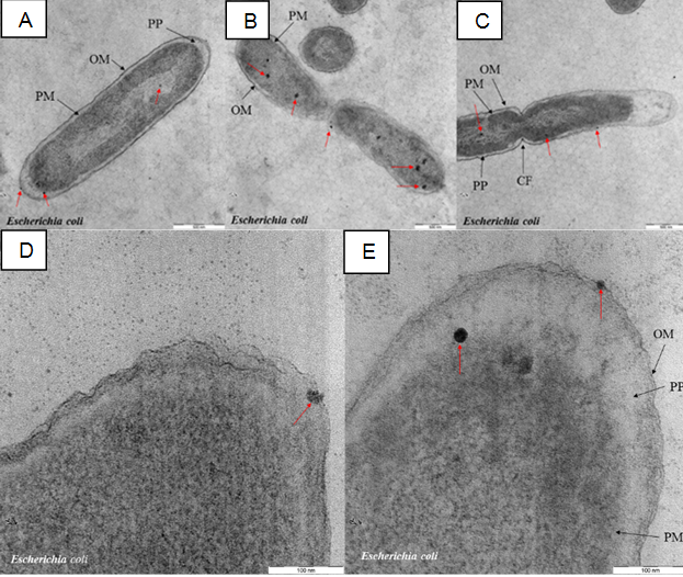
Figure 5 (A–D) revealed several Gram-positive bacteria conditions (S. aureus) after being exposed to the AgNPs. It is clearly shown in Figure 5 (A), the cell wall been invaded by AgNPs (red arrows) and causing membrane structure dissolution followed by the released of the content of the cell (lysed cells). Higher magnification image in Figure 5 (D) focusing on the high density of AgNPs accumulated at the cell wall and some particles were found embedded in the cell membrane. Similar inhibition fashion can be found for Gram-negative bacteria, E. coli (Figure 6). The AgNPs was embedded at the outer membrane and also in the periplasm, plasma membrane and cytoplasm of the bacteria (Lok et al., 2006; Reidy, Haase, Luch, Dawson, & Lynch, 2013; Song, 2006). Both Gram-positive (S. aureus) and Gram-negative (E. coli) bacteria had their cell wall “pitted” by AgNPs. The “pitting” effect on the bacteria by nanoparticle were reported previously (Choi et al., 2008; Li et al., 2011; Prabhu & Poulose, 2012; Rai, Yadav, & Gade, 2009; Sondi & Salopek-Sondi, 2004).
Based on these findings, the synthesized AgNPs able to penetrate and embed the bacterial cell wall and cause a disturbance on the membrane structure and eventually damage the bacteria cells consistent with the statement in (Buszewski et al., 2018). It is no doubt that the key factor of the inhibition mechanism mostly related to the interaction of AgNPs on the bacteria surface and have been reviewed in details in (Durán, Silveira, Durán, & Martinez, 2015). Based on the MIC value, the antibacterial activity of AgNPs against E. coli is much better compared to S. aureus. The plausible reason for this phenomenon is associated with a different characteristic of the membrane structure. A similar finding was reported previously, and they suggested that factors such as the difference in membrane structure of bacteria species; lipopolysaccharides for Gram-negative and peptidoglycan for Gram-positive and thickness of the peptidoglycan layer possibly lead to the AgNPs antibacterial efficiency.
Conclusion
Silver nanoparticles have been successfully synthesized using the citrate reduction method producing a narrow size distribution within 1-10 nm with most of them appeared to be spherical. Escherichia coli exhibited low MIC value with 0.049 mg/mL as compared to Staphylococcus aureus, with 0.391 mg/mL, and it corresponds to the effective antibacterial activity of the citrate-reduced AgNPs. Observation on the bacterial surface structure provides a useful insight into the AgNPs mechanistic aspects of AgNPs against Staphylococcus aureus and Escherichia coli and in agreement with most of the reported studies.