Pregelatinized Starch: Variability in Gelatinization and its Influence on Product Performance
Abstract
Starch and its derivatives are one of the significant excipients used in the pharmaceutical formulations due to their multi-purpose functionalities. The purpose of this study is two-fold: (1) Firstly, to propose a systematic approach in understanding the material properties of a starch derivative (pregelatinised starch/PGS) using analytical ‘toolbox’ as part of ‘alternative supplier sourcing’, and secondly (2) To demonstrate the effect of PGS from different vendors on the tablet disintegration using model formulations. Contextually, a two-tier characterisation procedure is generally considered as a prerequisite for establishing the sameness of the material obtained either from different batches or from various vendors. Primarily, the sameness between typical quality-control tests and compendial requirements are to be established. If similar, then sameness between the functional characteristics is to be established. In this context, the PGS from two vendors met the specifications, and there were no differences for the test results in the certificates of analysis. However, when subjected to functionality assessment, the two lots were found to be distinctly different. The influence of the functional property variations was further exemplified from viscosity results of raw material. Furthermore, this difference was even more evident when the model formulations were subjected to disintegration testing. The similarity in compendial tests but significant differences in functionality characteristics for the PGS of two vendors can be unravelled by considering variations in particle size, crystallinity, starch retrogradation and these changes are potentially attributed to the differences in the gelatinisation procedures adopted by the vendors.
Keywords
Functional Characteristics, Starch Retrogradation, Crystallinity, Particle Size, Birefringence, Gelatinization, Disintegrant-Binder properties, Viscosity, Disintegration test
Introduction
Alternate supplier evaluation for active pharmaceutical ingredients (APIs) and excipients is one of the critical projects that are currently sponsored within many pharmaceutical companies (Saravanan, Muthudoss, Khullar, & Rosevenis, 2019). The motivation behind “Alternate Supplier Sourcing Projects or simply Alternate Sourcing” are numerous, few of which are: cost savings, the addition of more than one supplier, streamlining or reduction in the number of suppliers, overcoming supplier monopoly, quality issues with current suppliers, business contingency plans etc. (Moreton, 2019). "Alternate sourcing" are activities wherein new product development is not involved, however, involves the replacement of one or more components of an existing formulation that can be either API or excipients. APIs are the ingredients that are intended to furnish pharmacological actions. Whereas, excipients are added to pharmaceutical drug formulations to assist in the manufacturing, improve dosage form's stability, bioavailability, patient acceptability etc. (Kubbinga, Moghani, & Langguth, 2014). Excipients have been historically characterised as non-functional constituents that have no impact on the therapeutic activity of the medicine, and, in this context, the substitutions are carried over (Kushner, 2013). The primary assumption behind such projects is "excipients sameness” based on “Certificate of Analysis or CoA” (Bejarano, Nadungodage, Wang, Catlin, & Hoag, 2019).
However, time and again, there has been a body of literature evidence indicating excipient functional characteristics playing a critical role on manufacturability, processability and product performance (Ruban, Pidpruzhnykov, & Kolisnyk, 2018). There is now an increased awareness about the role of excipients and their influence they exert on the developed formulations (Abrantes, Duarte, & Reis, 2016). Although the supplier change does not have a regulatory impact, it does require experimental validation (Charoo, 2020). The route to identity, purity, etc. are addressed and are provided as 'excipient specifications' in the pharmacopoeias which are also provided as CoA by the vendors (Ramesh, Yadav, & Sarheed, 2019). However, assessment for excipient function or functionality specifications are not provided (Elder, Kuentz, & Holm, 2016). One reason could be that since the excipients play a multitude of roles in the formulation, hence, it is controversial to include the functional property assessment in the monograph (Gamble et al., 2010). Nevertheless, it is the necessity of the formulator to understand the functional property requirement as well as its assessment to provide products with consistent quality. To overcome such undesirable events, guideline documents (2015/C 95/02) have been formalised to regulate supply chain of excipients with the idea of ascertaining risk assessment procedures, those, similar to APIs (Kader, 2016).
In most cases, the mono source accessibility of critical raw material is regarded as a significant financial and quality risk (Jaberidoost, Nikfar, Abdollahiasl, & Dinarvand, 2013). As part of business contingency plans in meeting market demands, a common strategy widely adopted is “pharmaceutical alternate sourcing” and to have more than one suppliers/vendor (Wöhl-Bruhn, Bertz, Kuntsche, Menzel, & Bunjes, 2013). That said, to provide a successful exchange of one excipient with others in the formulation, it is often required for suppliers to markdown the source of origin of excipients. Historically, excipients were obtained from minerals, plants, microorganisms, chemical modification of a natural compound upon purification, or purely chemical synthesis etc., the final product variability either preexists (natural sourcing) or is created during manufacturing or may arise due to inadequate excipient functional specifications. These variabilities can exist between suppliers (inter-variability) or within suppliers' batch (intra-variability) (Zhao & Augsburger, 2006). As per the law of variation, everything varies as well as it is random; subsequently, control of variability becomes difficult. It is imperative to delineate the variability, causing compromise on product quality from white noise.
As per ICH Q8 requirements (Srinivasan & Iser, 2009), the quality compromising variability should be described as critical. In such scenarios, the following attributes are identified as part of the requirements which are (i) critical material attributes (referring to quality compromised due to input materials, CMAs), (ii) critical process parameters (referring to quality compromised due to manufacturing process, CPPs), (iii) critical quality attributes (referring to quality compromised due to output product, CQAs) (Simões et al., 2020). To consistently deliver on the intended product performance (CQAs) as well as avoiding batch failures and product recalls, understanding the impact of CMAs, as well as CPPs, are required. The correlation of manufacturing process on final product characteristics is well-understood and well-documented. Interestingly, while developing a robust formulation, a thorough consideration of the variabilities associated with both raw material and process should be performed as well as documented. In doing so, either of the two common approaches is utilised (i) traditional approach: involves tightening the specifications concerning API, excipients and process, (ii) QbD approach: expected variabilities from API as well as excipients are incorporated and; appropriate process end-point identified (Simões et al., 2020). The advantage concerning QbD approach is that, during manufacturing, the complex interplay between API, excipients, and process are controlled effectively, while, the traditional approach might not address the interactions (Yu et al., 2014).
Interestingly, FDA adopted the question-based review (QbR) which requires the sponsors to understand, integrate and implement the effect of raw material variability to assure product quality through optimal process design and performance-based specifications (Srinivasan et al., 2009). For this, a detailed understanding of a substance's chemical, structural, molecular, particulate, mechanical, and bulk properties are to be explored and, will be a prerequisite to link the material properties to CPPs and CQAs (Simões et al., 2020). Various researchers have extensively characterised the impact of the excipient material property variations, lot-to-lot/batch-to-batch variations, source-to-source variations for microcrystalline cellulose (MCC) (Haware, Bauer-Brandl, & Tho, 2010), native and pregelatinised starch (Adedokun & Itiola, 2010), lactose (Ticehurst, York, Rowe, & Dwivedi, 1996), sodium starch glycollate (SSG) (Shah & Augsburger, 2002), magnesium stearate (Zarmpi, Flanagan, Meehan, Mann, & Fotaki, 2020), dicalcium phosphate (DCP) (Landín, Rowe, & York, 1994), hydroxy propyl cellulose (HPC) (Alvarez-Lorenzo et al., 1998), carbomer (Pérez-Marcos et al., 1993), glyceryl monostearate (O’laughlin, Sachs, Brittain, & Cohen, 1989), polyethene glycol (PEG) (Wöhl-Bruhn et al., 2013), croscarmellose sodium (Zhao et al., 2006), Xanthum gum (Thacker, Fu, Boni, & Block, 2010), crospovidone (Shah & Augsburger, 2001) etc., using various analytical methods in a way to understand as well as control the variability on the performance and manufacturability of dosage forms.
The primary objective of this work is to have a robust yet straightforward 'toolbox' to identify the critical material attributes of pregelatinised starch (PGS) and its suitability to screen the incoming raw materials. There are various types of starch like waxy starch, high amylose containing, and high amylopectin containing starches. These variations can have a profound influence on product performance; that is, the high amylose starch is used as a binder while high amylopectin provides disintegrating properties. Similarly, the pregelatinised starch can undergo retrogradation which could potentially influence the properties. Analytical ‘toolbox’ employed to characterise PGS were X-Ray Powder Diffraction (XRPD), Raman spectroscopy, polarised light microscopy, laser diffraction, thermogravimetry, viscosity measurements etc. A comprehensive understanding of the functionality of pregelatinised starch (PGS) would be essential. Based on the understanding obtained from the solid state studies, a model API, and excipients along with PGS from two vendors (labelled as Vendor 1 and Vendor 2) were studied. Once the functional assessment was carried out, model formulations were prepared and characterised.
|
Vendor 1 |
Vendor 2 |
|
|---|---|---|
|
Run 1 |
4.5 |
8.8 |
|
Run 2 |
4.7 |
9.5 |
|
Run 3 |
4.8 |
9.7 |
|
Average |
4.7 |
9.3 |
|
SD |
0.2 |
0.5 |
|
RSD |
3% |
5% |
Materials and Methods
Materials
Two different batches were formulated using model API, excipients (hypromellose, microcrystalline cellulose/MCC, pregelatinised starch/PGS, Sodium Stearyl Fumarate) whose batch numbers and vendor source were all kept constant. Moreover, identical formulation procedures were followed with one exception: pregelatinised starch (PGS) sourced from two vendors. The PGS from two different vendors were found to be similar concerning the certificate of analysis (CoA). However, the disintegration of tablets was found to be much dissimilar.
Powder X-Ray Diffraction (PXRD)
PXRD profiles of pregelatinised starch from two sources were collected on Bruker powder X-ray diffractometer (Model D8 ADVANCE); with theta-theta geometry, a Copper anode (Kα1, λ = 1.5406 Å) and LynxEyeTM detector. The X-ray tube was operated at a voltage of 40 kV and a current of 40 mA. Each diffraction profile was collected in continuous mode and the scan range of 3° to 45° 2θ, with a step size of 0.01° 2θ and with a time per step of 0.1 sec. Top loading method was employed for sample preparation using PMMA (Poly-methyl methacrylate) sample holder (25 mm). The data processing was performed using Bruker Eva software. Parameters like sample grinding and rotation of holder were studied to understand the preferred orientation effects.
Particle Size Analyser (PSA)
Particle size distribution (volume-weighted) of PGS was measured by laser light diffraction (Malvern Mastersizer 2000, Malvern Instruments, Worcestershire, UK) using a dry sampling unit. Particle size calculation involved Mie theory approximation, and the following standard operating procedure (SOP) was used which were as follows, refractive index: 1.52, vibration feed rate: 25%, measurement time: 7 s, dispersive air pressure: 4 bar. Particle size distribution is characterised by the mass median diameter (d0.5), i.e., the size in microns at which 50% of the sample is smaller, and 50% is larger, and the volume mean diameter (D4,3). Values presented are the average of at least three determinations.
Polarised Light Microscopy (PLM)
The polarised microscopic images of PGS were recorded with a CCD camera attached to the Nikon LV100 POL microscope and the data were analysed using the in-built NIS elements software. Few mg of samples were placed on a clean glass slide and were examined using PLM under various magnifications. To perform the birefringence experiments and to detect very weak birefringence, the λ/4 compensator is utilised. Optical, average particle size, particle shape and sample agglomerative properties of both the samples were compared.
Thermogravimetric Analyzer (TGA)
Thermal analysis was conducted using thermal gravimetric analysis (TGA) instrument (model: 851e/LF1100, Mettler-Toledo GmbH, Switzerland) equipped with a robotic arm (model: TSO801RO) for automated sampling. The TGA was conducted on pregelatinised starch from two vendors (sample weight was kept consistent ~10 mg). The total weight of each sample (accurately weighed into open 70 μL aluminium oxide crucibles using the TGA microbalance) was 10 (± 1) mg. The powder sample was heated from 25 to 200 °C at a heating rate of 10 °C/min, under a nitrogen flush (10 mL per min). The instrument measured the change in mass and recorded the temperature profile and was calibrated using indium. Data were analysed using Stare Base Software for Windows 7(Mettler-Toledo GmbH, Switzerland)
Raman Spectroscopy
Raman spectra of PGS in triplicates for each sample were recorded with a Kaiser Raman RXN2 Analyzer (Kaiser Optical Systems, Inc., Ann Arbor, MI). The excitation wavelength of 785 nm actuated at 200 mW. Signals were detected by a Charge-Coupled Device (CCD) camera. Spectral acquisitions were made by using the iC Raman software (Kaiser Optical Systems). Spectral acquisitions were obtained in the range 100–1800 cm-1, at a resolution of 1 cm-1 and each run contained an average of 75 scans as well as 10 s exposure time settings which resulted in a 15 min‐long acquisition profile. The recorded Raman spectra were exported in .csv format and were processed in MS-Excel 2010.
Viscosity Measurements
The viscosity of the pregelatinised starches from two different vendors was studied over one hour. The samples (~5 grams) were taken in a 500 ml beaker to which 270 ml of distilled water was added, and the temperature was set at 25 °C whilst stirring. The samples were added slowly for one minute. Stirring was continued for two minutes, and the speed of the stirrer was adjusted to prevent the formation of vortex, agglomeration and incorporation of air. The viscosity of the prepared suspensions was determined by using a Brookfield viscometer (Model DV III, Brookfield Engineering Lab, Stoughton, MA, USA) at 100 rpm using a UL adapter and ULA spindle. Viscosity measurements were made in triplicate and were monitored regularly, and, the values were recorded after 60 mins.
Model Formulation
API, hypromellose, microcrystalline cellulose, pregelatinised starch were accurately weighed and passed through a 40-mesh screen to get uniform size particles and mixed in a blender for 15 min. The obtained blend was lubricated with sodium stearyl fumarate, and mixing was continued for a further 5 min. The only change being the pregelatinised starch procured from Vendor 1 (Model formulation-1) and Vendor 2 (labelled as model formulation-2). The resultant mixture was directly compressed into tablets by using 9 mm round flat-faced punch. Compression force was kept constant for both the formulations.
Disintegration Testing
As per the recommendations from the United States Pharmacopeia (USP) compendial test (701), product performance was assessed using disintegration testing which states the use of disks to understand the particle deaggregation as well as end-point detection in water as the immersion fluid (Davani, 2017). Average values obtained by testing six tablets disintegration were used to compare the performance of the model formulations.
Results and Discussion
Indeed, it is well-recognised that the composition and structure of the starch control its properties (Whistler, Bemiller, & Paschall, 2012). These influencing parameters can then be categorised into following: structural-level, molecular-level, particle-level, bulk-level as well as the impact of these parameters on the performance of the material.
Excipient Variability Analysis at Structural-Level using XRPD and PLM
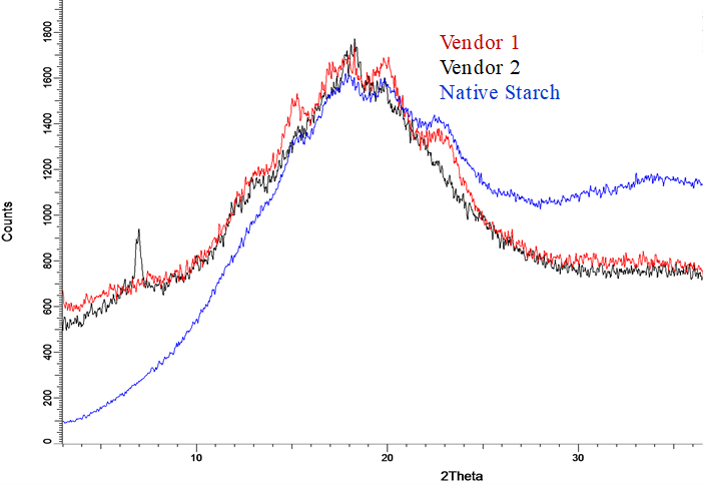
The native starches possess two types of crystallinity (i) A-type, predominantly found in cereal starches (except high amylose variety), (ii) B-type, abundant in root and tuber starches (Whistler et al., 2012). The X-ray diffractograms of native corn starch samples and pregelatinised samples from two vendors are shown in Figure 1. The native starch samples displayed high-intensity peaks at Bragg's angle (2θ) about 15°, 18°, and 23° that is representative of typical A-type crystalline pattern indicating its semi-crystalline nature. XRPD patterns for Vendor 1 displays peak at 2θ = 15°, 17°, 18° and 23° are visualised, suggesting that a certain degree of ordering of native corn starch is retained. On the other hand, XRPD patterns for Vendor 2 demonstrates halo and a peak at low 2θ = 5°. Based on these results, it can be interpreted that Vendor 1 provides a partially crystalline pregelatinised starch while Vendor 2 provides an amorphous grade of pregelatinised starch.
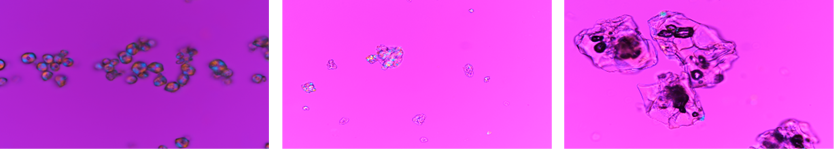
As illustrated in Figure 2. upon examination of native starch granules under a polarised light microscope (PLM), a typical birefringence with precise Maltese crosses is visualised due to the hilum. Similarly, when pregelatinised starch from Vendor 1 is observed under PLM, majority of the granules were aggregated, slightly swollen but displayed a degree of birefringence, suggesting that the granules were not entirely disrupted, however, maintained a certain degree of crystallinity. Nevertheless, no birefringence can be observed in granules from Vendor 2, indicating that the ordered structure of starch was fully gelatinised and entirely disrupted (Liu et al., 2017). The outcome of PLM measurements was consistent with the result of X-rays, showing the variability in the crystallinity between two materials.
Excipient Variability Analysis at Molecular-Level using Raman Spectroscopy
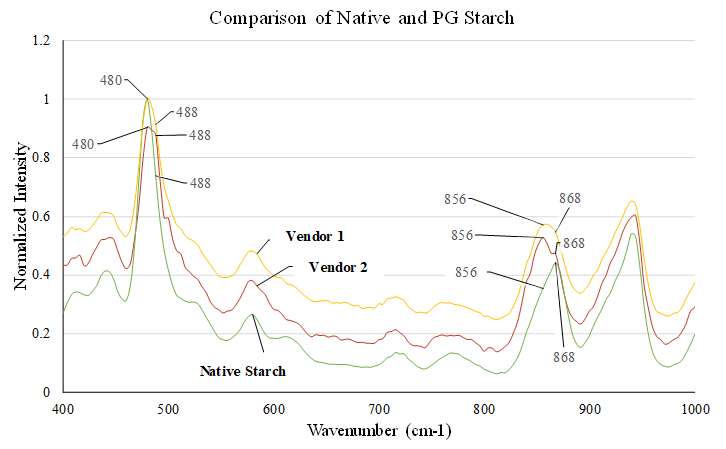
The gelatinisation process and its completion can be followed using vibrational spectroscopy (NIR, FTIR and Raman). The region between 450 to 500 cm-1 and 800 to 900 cm-1 is used to understand. Changes in peak width could be correlated to alteration in crystallinity/amorphicity (Mutungi, Passauer, Onyango, Jaros, & Rohm, 2012). Similarly, changes in peak intensity/position are indicative of different proportions of amylose or amylopectin, degree of crystallinity, starch retrogradation among the investigated samples. The peak at 480 cm-1 and 488 cm-1, as well as 868 cm-1 and 856 cm-1, are assigned to crystallinity changes as well as to starch retrogradation, respectively (Flores-Morales, Jiménez-Estrada, & Mora-Escobedo, 2012). The high intensity of 488 cm-1 and 856 cm-1 indicates that Vendor 2 is fully pregelatinised while the opposing trend with Vendor 1 indicates the material has retrograded and recrystallised. Reiterating, starch is composed of alternating crystalline and amorphous regions which is evidenced with the illustrative maltese cross in PLM images. Peak width was found to be discriminative in the following chronological order native starch<Vendor 1<Vendor 2 indicating the Vendor 2 samples are amorphous, Figure 3. These results are in line with XRD and PLM. The correlation of starch granule size with the starch retrogradation indicates a completely varied gelatinisation pattern for Vendor 2.
Excipient Variability Analysis at Particle-Level using Laser Diffraction and Optical Microscopy
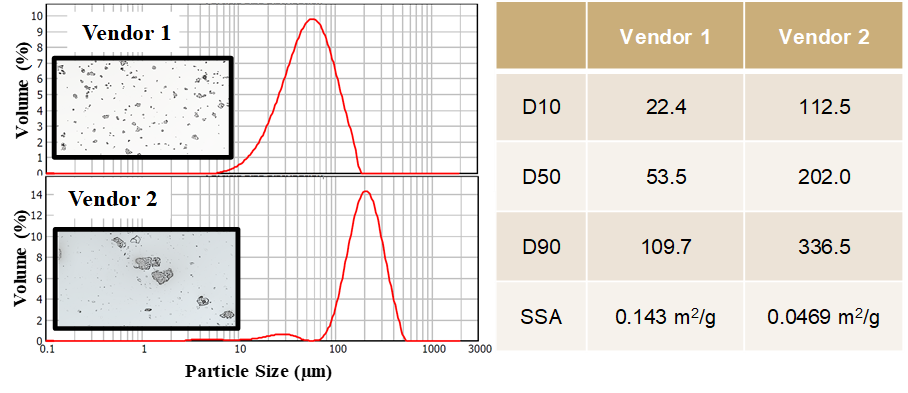
The pregelatinised starch particle sizes (in microns) obtained from both the vendors using laser diffraction are presented, see Figure 4. Particle size distributions were unimodal, narrow, however Vendor 1 showed d10 = 22 µm, d50 = 54 µm and d90 = 110 µm that were smaller in comparison with Vendor 2 which were d10 = 113 µm, d50 = 202 µm and d90 = 337 µm, respectively. There is a firm agreement between the particle sizes that are observed using microscopy and which is measured using laser diffraction.
Excipient Variability Analysis at Bulk-Level using TGA
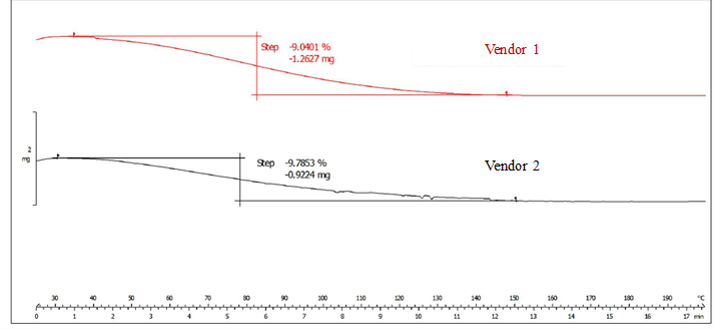
Thermogravimetric analysis (TGA) offers detailed information on mass transition, temperature ranges typical of moisture/volatile release, and kinetic information. Representative thermograms are shown in Figure 5. The thermogram shows one weight-loss event/extensive endotherm observed between RT and ~140 °C, which is due to loss of water. This is consistent with both vendors demonstrating similarity in a loss on drying.
Excipient Variability and Correlation with Performance-Viscosity Measurements
The impact of both starch retrogradation, as well as particle size, was correlated to PGS performance by measuring the viscosity build-up as a deterministic parameter for 60 mins. That is, it is vital to understand the rheological or flow behaviour to compare the binder/disintegrant efficiency of pregelatinised starch. Since PGS demonstrates shear thinning behaviour where the viscosity decreases along when the shear rate increases. Hence the shear rate was kept constant for PGS obtained from both the vendors.
The efficiency of PGS from both the vendors has been evaluated as a function of the viscosity. The 2% w/v aqueous dispersion maintained at a temperature of 25 °C for Vendor 1 and Vendor 2 had a viscosity of 4.7 ± 0.2 cP and 9.3 ± 0.5 cP, respectively, for details refer Table 1. That is, Vendor 2 demonstrated higher viscosity than Vendor 1, which could retard dissolution due to viscosity build-up (Zámostný, Petrů, & Majerová, 2012). Additionally, formulations were prepared and subjected to disintegration testing.
Excipient Variability and Correlation with Performance-Disintegration Testing
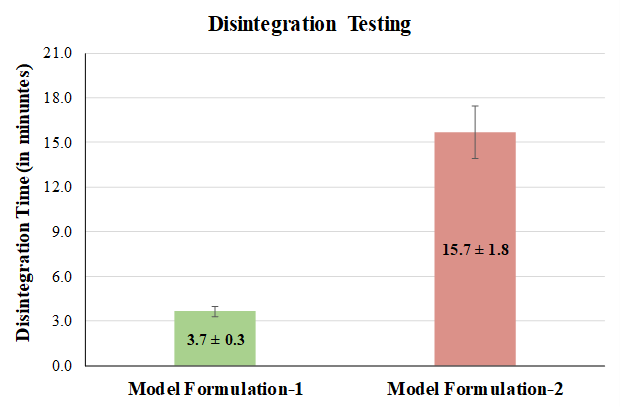
Two formulations were prepared to test the hypothesis mentioned above using the same components (API and excipients), with one exception, which is PG starch from two different vendors. In one formulation, PG starch from Vendor 1 (termed model Formulation-1) was used while in the other formulation Vendor 2 (termed model Formulation-2) was employed. Since the API in the formulations is categorised as BCS class 3, the use of disintegration as a surrogate test to dissolution is employed (Nickerson, Kong, Gerst, & Kao, 2018). Disintegration results for both the model formulation tablets manufactured using different PG starch values are provided in Figure 6. Model formulation-1 was found to comply with the in-house specification, which is, disintegration time of <4.5 mins while the model formulation-2 show a DT of ~15 mins. Results indicate that the mean time taken for the disintegration of model formulation-2 is higher in comparison with the other formulation.
Correlation of Physical Characterisation with Performance Tests
Pregelatinized starch is a modified corn starch which exhibits high water holding capacity. Furthermore, it is a versatile excipient that is pH-independent disintegrant, diluent, stabiliser for water-sensitive drugs etc. Physico-chemical characterisation indicated that Vendor 1 contained smaller particles, birefringence, crystallinity similar to native starch. In contrast, Vendor 2 was found to be more like an amorphous fully pregelatinised starch. In order to correlate the material property, two performance measurement tools like viscosity test for PG starch and disintegration test for model formulations were carried out. The viscosity of Vendor 2 resembled the specification of pregelatinised material in line with the specifications, while for Vendor 1, it was close to native starch.
Similarly, the disintegration test was evaluated for a potential correlation. The disintegration time for the model formulation-1 was within the specification of <4.5 mins while for model formulation-2 it was ~15 mins. The trends observed with disintegration, mirror those observed with the physicochemical measurements and viscosity measurements. It has been well-recognised that full pregelatinization makes the excipient soluble in cold water and the PGS would behave as a binder while it would be ineffective as a disintegrant. Zamostny and Majerova explained that the soluble portion of pregelatinised starch would swell (related to the cold water solubility of PG starch) and it could inhibit the caffeine diffusivity (Zámostný et al., 2012). That is, the PG starch from Vendor 2 displayed binding property, whereas PG starch from Vendor 1 displayed disintegrant property.
Conclusions
A primary objective of this study was to evaluate the functionality of pregelatinised starch from two different vendors as part of ‘Alternate Sourcing Strategy”. Albeit the monograph provides tests of purity and identification, it does not provide any assurance on the materials’ functional characteristics or their influence on the performance of the product. Results of this study confirmed that the differences in crystallinity, starch retrogradation, particle size within the pharmacopoeial specifications could display significant differences in their influence on PG starch viscosity and tablet disintegration. Moreover, it is demonstrated that minimal variations in the properties of the pregelatinised starch, which is used as a disintegrant or binder in drug product formulations, can significantly alter the release profile of active pharmaceutical ingredient. That is, a thorough characterisation of the material properties and its correlation to product performance is considered imperative. In conclusion, functional similarity rather than pharmacopoeial similarity is considered as the key criterion for the projects involving "Alternate Sourcing Strategy".
Acknowledgement
We are so much obliged to Sanofi and Dr Praveen Khullar, Head of Global Development Centre, Sanofi Synthelabo (India) Private Limited, Goa and Dy. Head, Scientific and Technical Services, for providing the facilities to carry out the work mentioned above. We also thank Dr A. Rose Venis, Associate Professor, Department of Chemistry, St. Joseph’s College (affiliated to Bharathidasan University), Trichirappalli for providing guidance and the needful support.
Conflicts Of Interest
All authors declare that there are no conflicts of interest for this study.
Funding Support
All authors declare that there is no funding support for this study.